
Using Reports
| Owner |  Phoenix Ha Phoenix Ha |
|---|---|
| Tags | Data & AnalyticsProcess |
AdBeacon reports have been designed and consolidated into 3 main sections: Products, Customers and Orders to help your team succeed.
- Under each category, advanced reporting is available to identify key areas of opportunity, cut down time spent on reporting and unveil profit-driving trends to double down on.
- Feel free to use our AI widget (bottom right corner of your screen) to search for specific reports - below is a deep dive on what AdBeacon provides.
Customers
LTV
Lifetime value is the biggest lever to grow your business steadily and sustainably. The ability to analyze and activate this data is critical to your media buying needs.
- Below, we’ll walk you through all the capabilities AdBeacon offers to help aid these efforts.
What is my customer LTV in the last 30/60/90 days?
- To find this data, select the “Customer LTV” report: AdBeacon left side panel > Reports > Customers > Customer LTV
- Be sure to select the time frame in which you want the LTV report to populate - you will find this option in the right-hand corner of your Customer LTV Report.
.png)
- AdBeacon does the heavy lifting for you and calculates your customer LTV in the below tiles - found along the top of your Customer LTV Report
.png)
- The table below the LTV tiles are where to find individual customers with the highest LTV. Here, you’ll be able to filter based on audience type and LTV value
.png)
- To find this data, select the “Customer LTV” report: AdBeacon left side panel > Reports > Customers > Customer LTV
How to read the customer cohort report
Acquiring customers is only half the battle, here in the cohort analysis report, you’ll be able to identify whether a specific month drove higher/lower retention, revenue, and lifetime overall. AdBeacon left panel > Reports > Customers > Cohorts Analysis
.png)
- Here are some tips on how to read this data
.png)
- Read horizontally - let's check out the example above
- June acquired 5,350 new customers.
- Out of those new customers that came in June, 223 of them purchased again in July,
- 143 purchased again in August, and so on.
- Here, you can ask yourself the question, why did I acquire fewer customers in October but retain them at a much better rate than in November?
- Was it the offer? The promotional period? What worked and what didn’t in specific months?
- What can we do again that proved to provide the best LTV over a length of time?
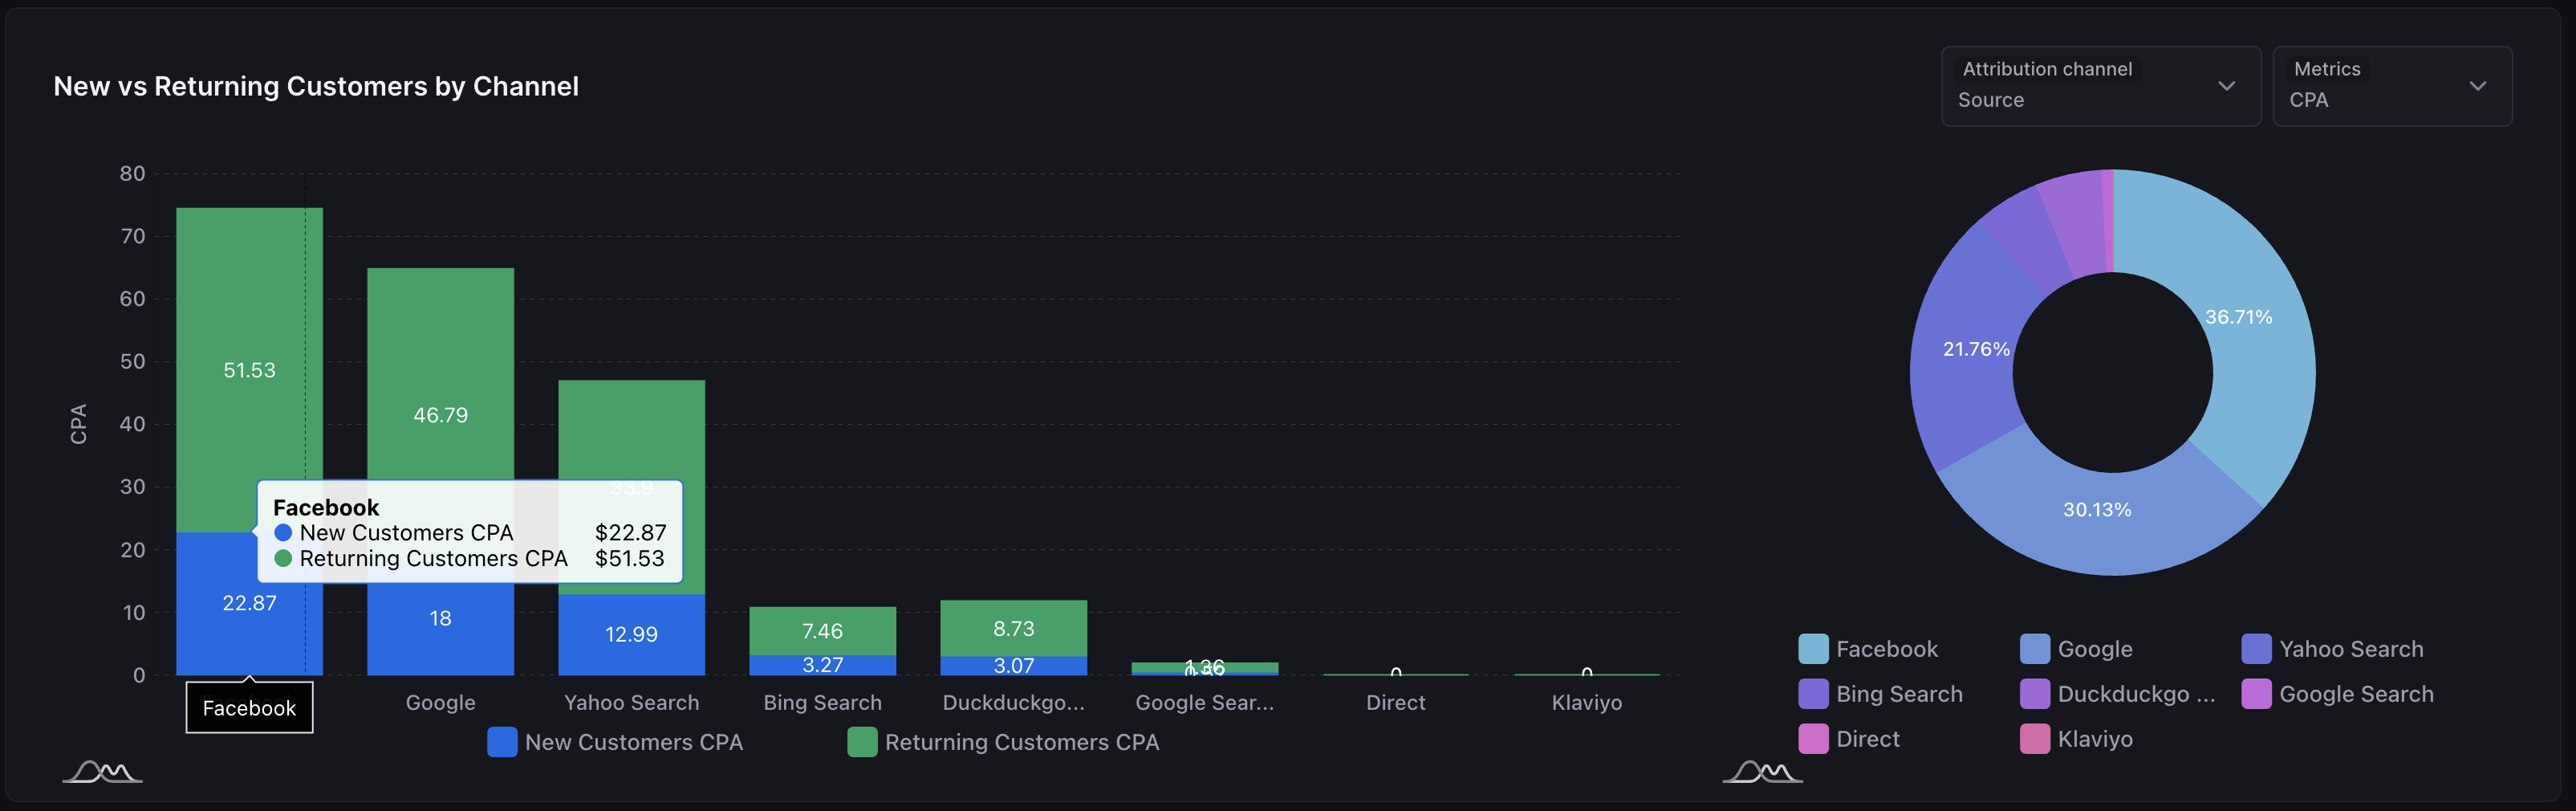
New vs Returning
Understanding what channels, products and even coupon codes drive new vs. returning customers unlocks an even more advanced marketing strategy.
Begin stitching together optimal routes to acquire new customers and reengage with existing customers with the AdBeacon New vs Returning report. (Left Panel > Reports > Customers > New vs Returning Customers)
.png)
What drives the lowest CPA for NEW customers?
- To find this data, select the “New vs Returning” report
- In the New vs. Returning report, you’ll be able to identify the top products, channels, coupon codes and cities that drive the the lowest cost per acquisition for new customers.
- You will find all these options in the “tabs” within your New vs Returning Customer Report (see screenshot below)
.png)
- Click on the channel/product/coupon code or city tab to get an in depth analysis no performance and trend of the selected metrics
.png)
- Consider identifying the top channels, products, and cities that drive the lost cost per acquisiton and feature them from optimal efficiency
- (For example)
- Lowest CPA product: Sweatshirt
- Lowest CPA channel: META
- Lowest CPA city: Los Angeles
Action: create a campaign in META, featuring the sweatshirt in your ad creative/drive customers to the sweatshirt landing page, and geo target Los Angeles
To prevent paying 2-3x for an existing customer to return, consider reviewing these reports to reengage at the lowest cost possible. Consider excluding existing customers, by creating the audience in our audience builder, to ensure your ad dollars are spent in the right channels.
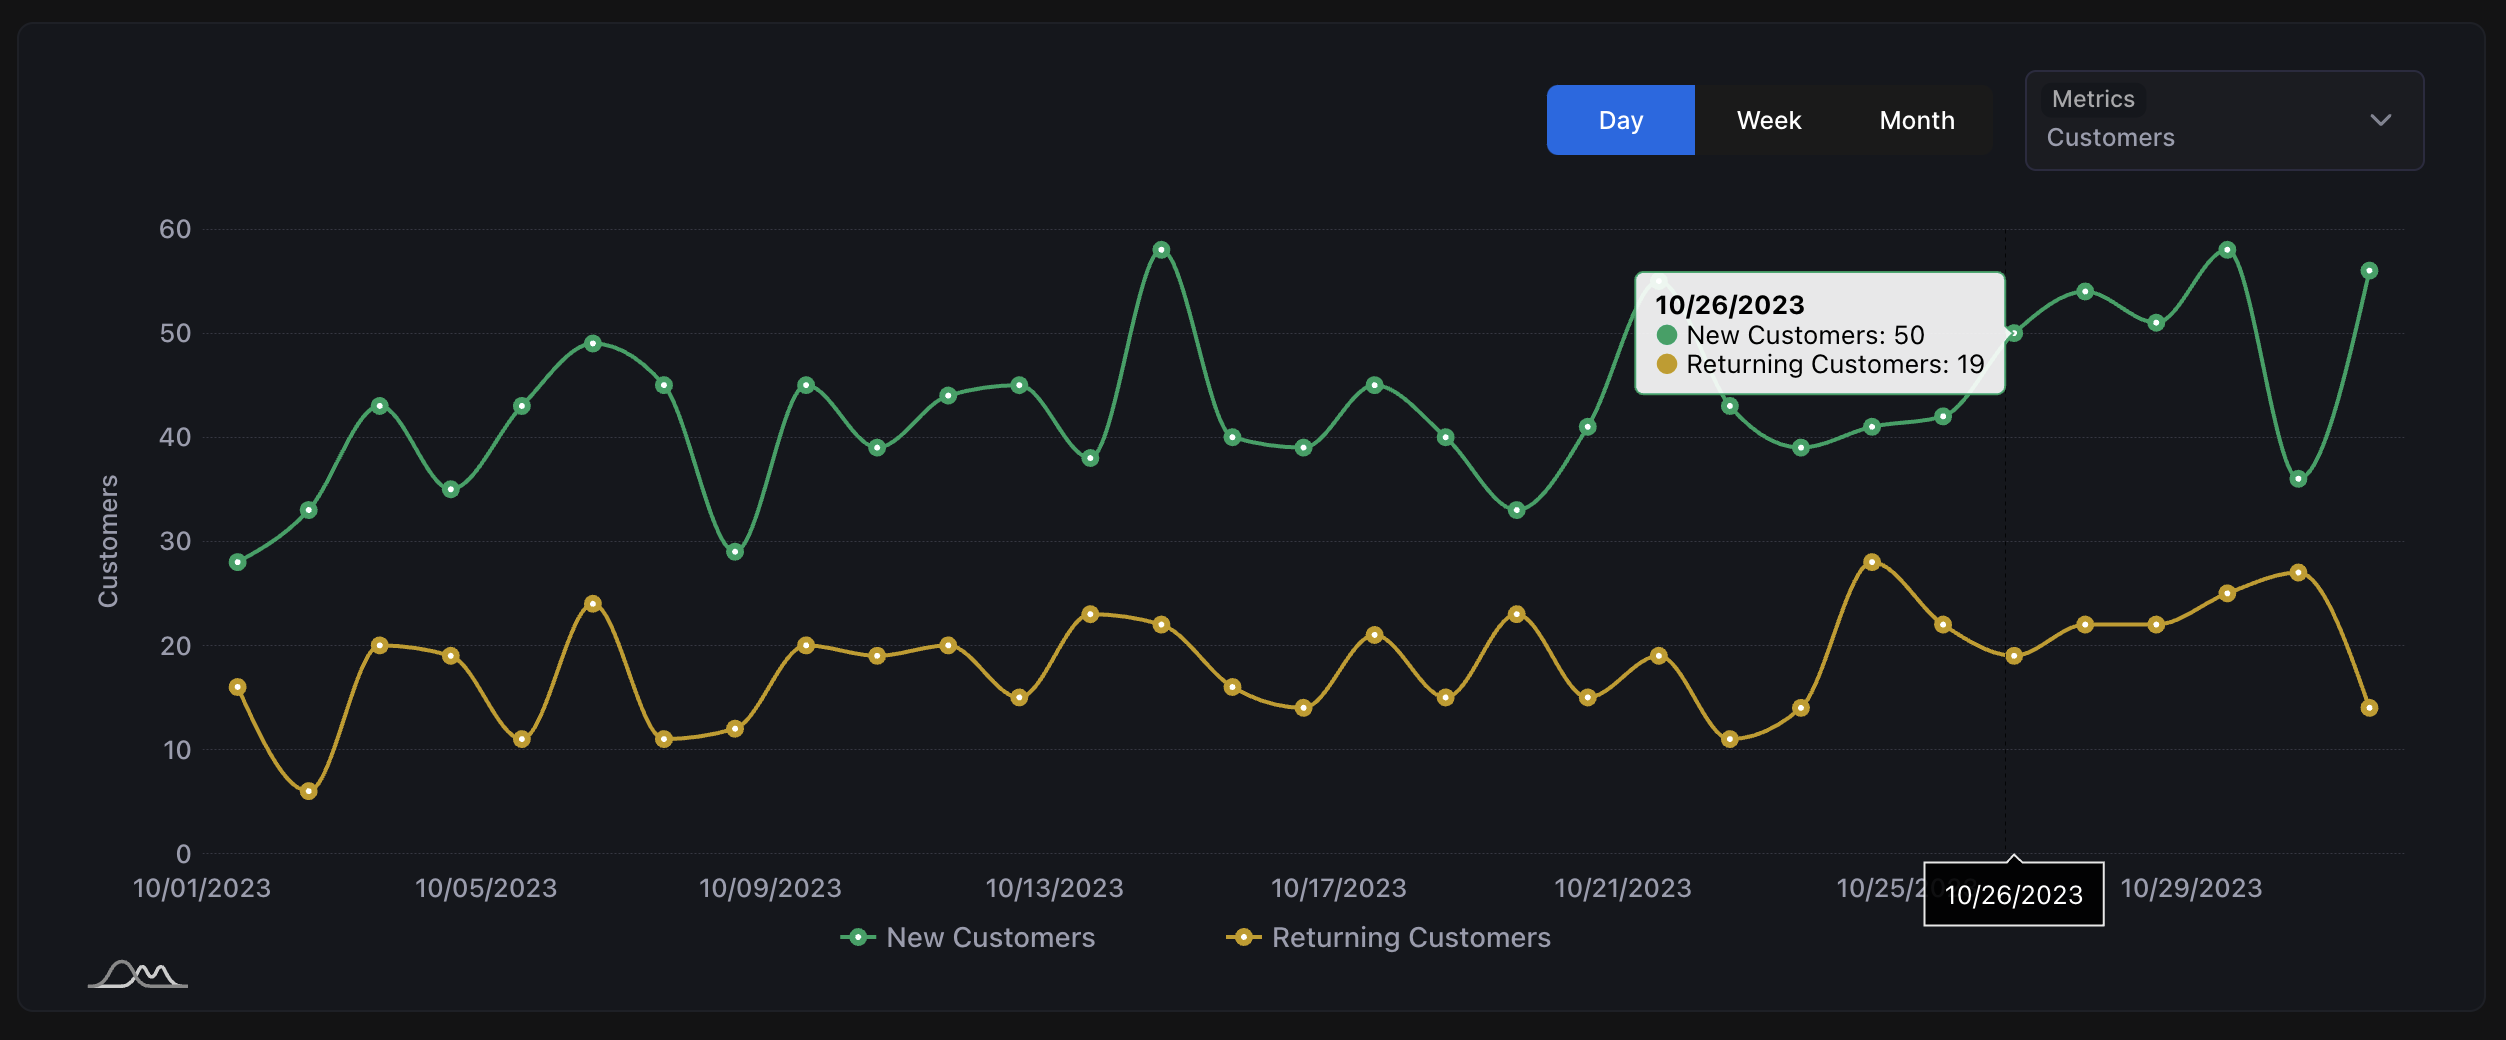
- AdBeacon gives you the ability to filter across the platform by new and returning customers so your team can scale effectively.
- (For example)
- To find this data, select the “New vs Returning” report
What drives the lowest CPA for returning customers?
- To find this data, select the “New vs Returning” report
- In the New vs. Returning Report, you’ll be able to identify the top products, channels, coupon codes and cities that drive the the lowest cost per acquisition for returning customers.
- Click on the channel/product/coupon code or city to get an in depth analysis no performance and trend of the selected metrics
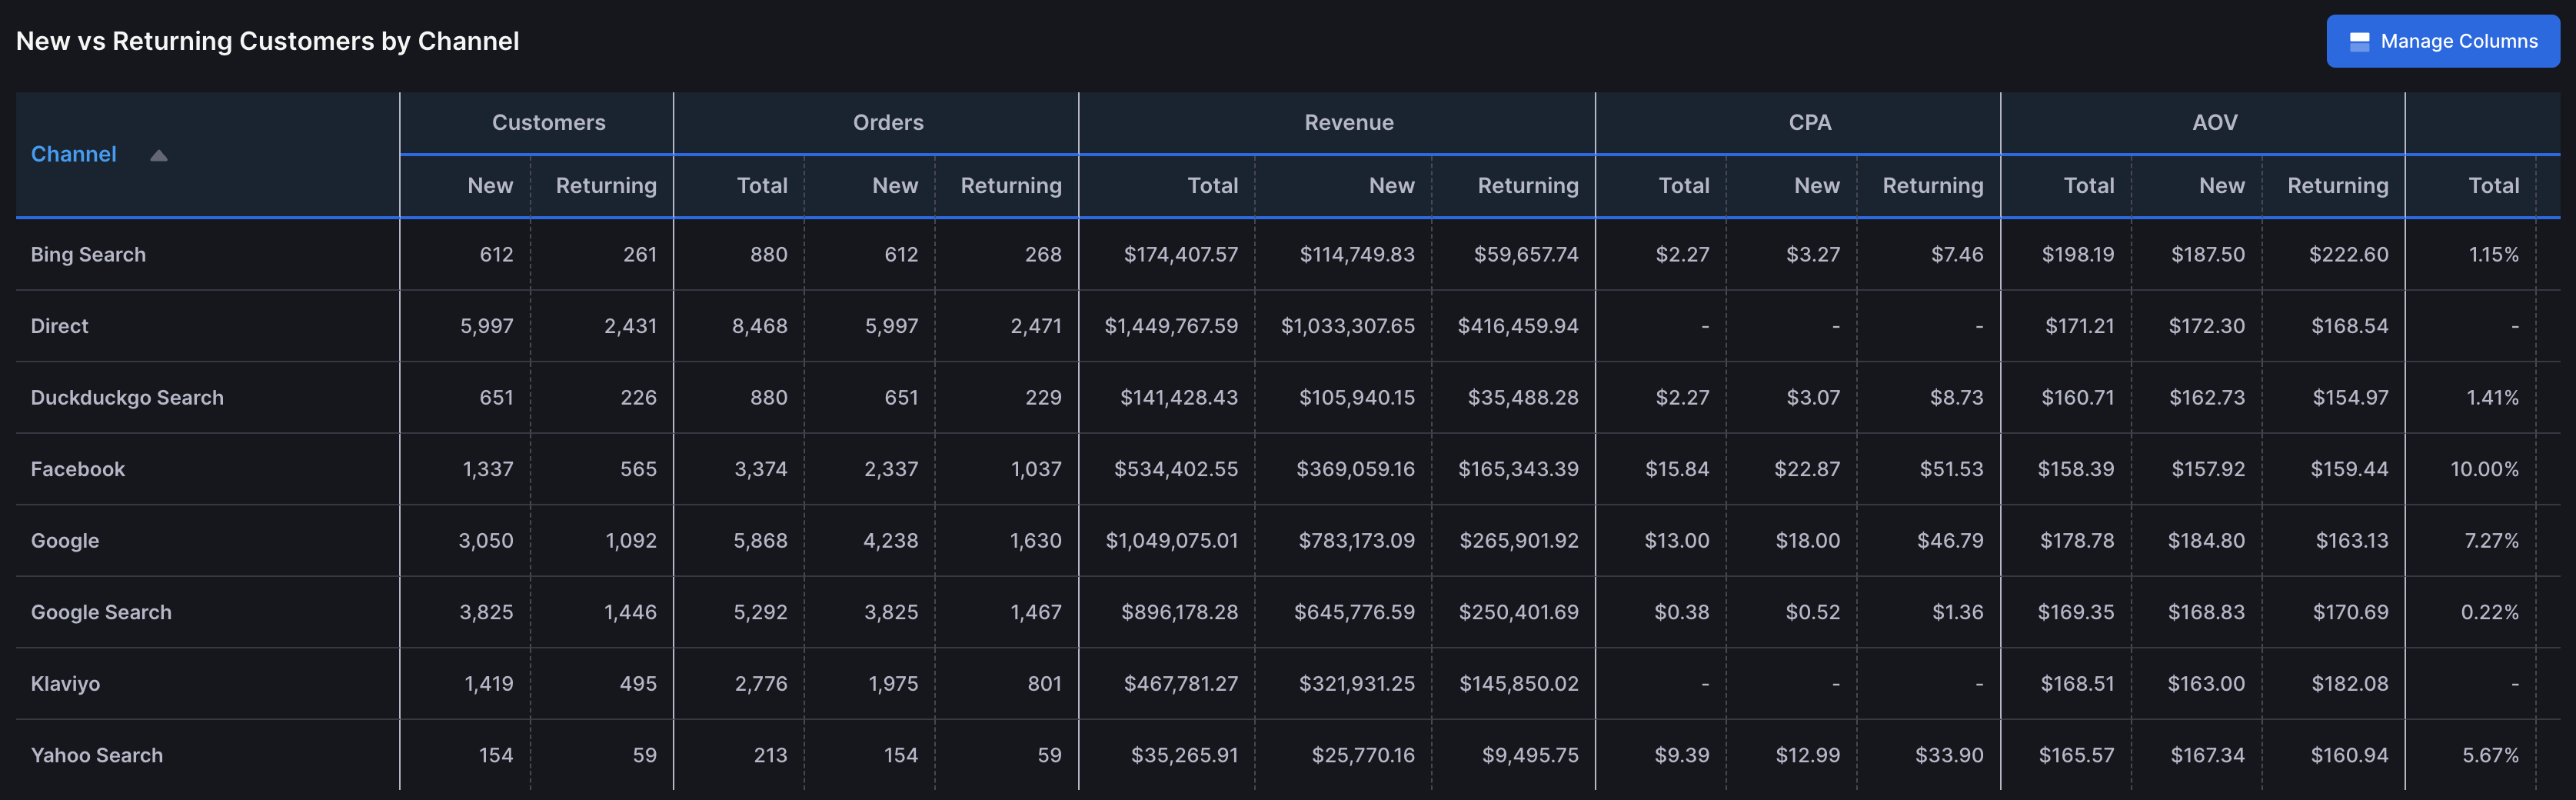
- Consider identifying the top channels, products, and cities that drive the lost cost per acquisiton and feature them from optimal efficiency
- ex)
- lowest CPA product: sweatshirt
- lowest CPA channel: META
- lowest CPA city: Los Angeles
Action: create a campaign in META, featuring the sweatshirt in your ad creative/drive customers to the sweatshirt landing page, and geo target Los Angeles.
To prevent paying 2-3x for an existing customer to return, consider reviewing these reports to reengage at the lowest cost possible. Consider excluding existing customers, by creating the audience in our audience builder, to ensure your ad dollars are spent in the right channels.
- AdBeacon gives you the ability to filter across the platform by new and returning customers so your team can scale effectively
- ex)
- In the New vs. Returning Report, you’ll be able to identify the top products, channels, coupon codes and cities that drive the the lowest cost per acquisition for returning customers.
- To find this data, select the “New vs Returning” report
RFM
The rise in lifetime value of a customer is the clear long term focus to sustainable growth in 2024. Online shoppers are savvy and understand that a good deal is just another click away. So, how are you standing out in a sea of noise to keep them coming back to your store?
You wouldn’t speak to your loyal customers the same way you’d speak to those who love to return your products… right? Well, we at least hope not. The first step is identifying who those loyal customers are, or better yet, how to grow those segments.
Here, we’ll break down what RFM (a ranking system) is and how it’s the key to unlocking an LTV driven strategy.
Rank your customers with RFM to first identify who your best/worst customers are, then utilize 1st party data via AdBeacon to optimize your channels for impactful messaging and conversion.
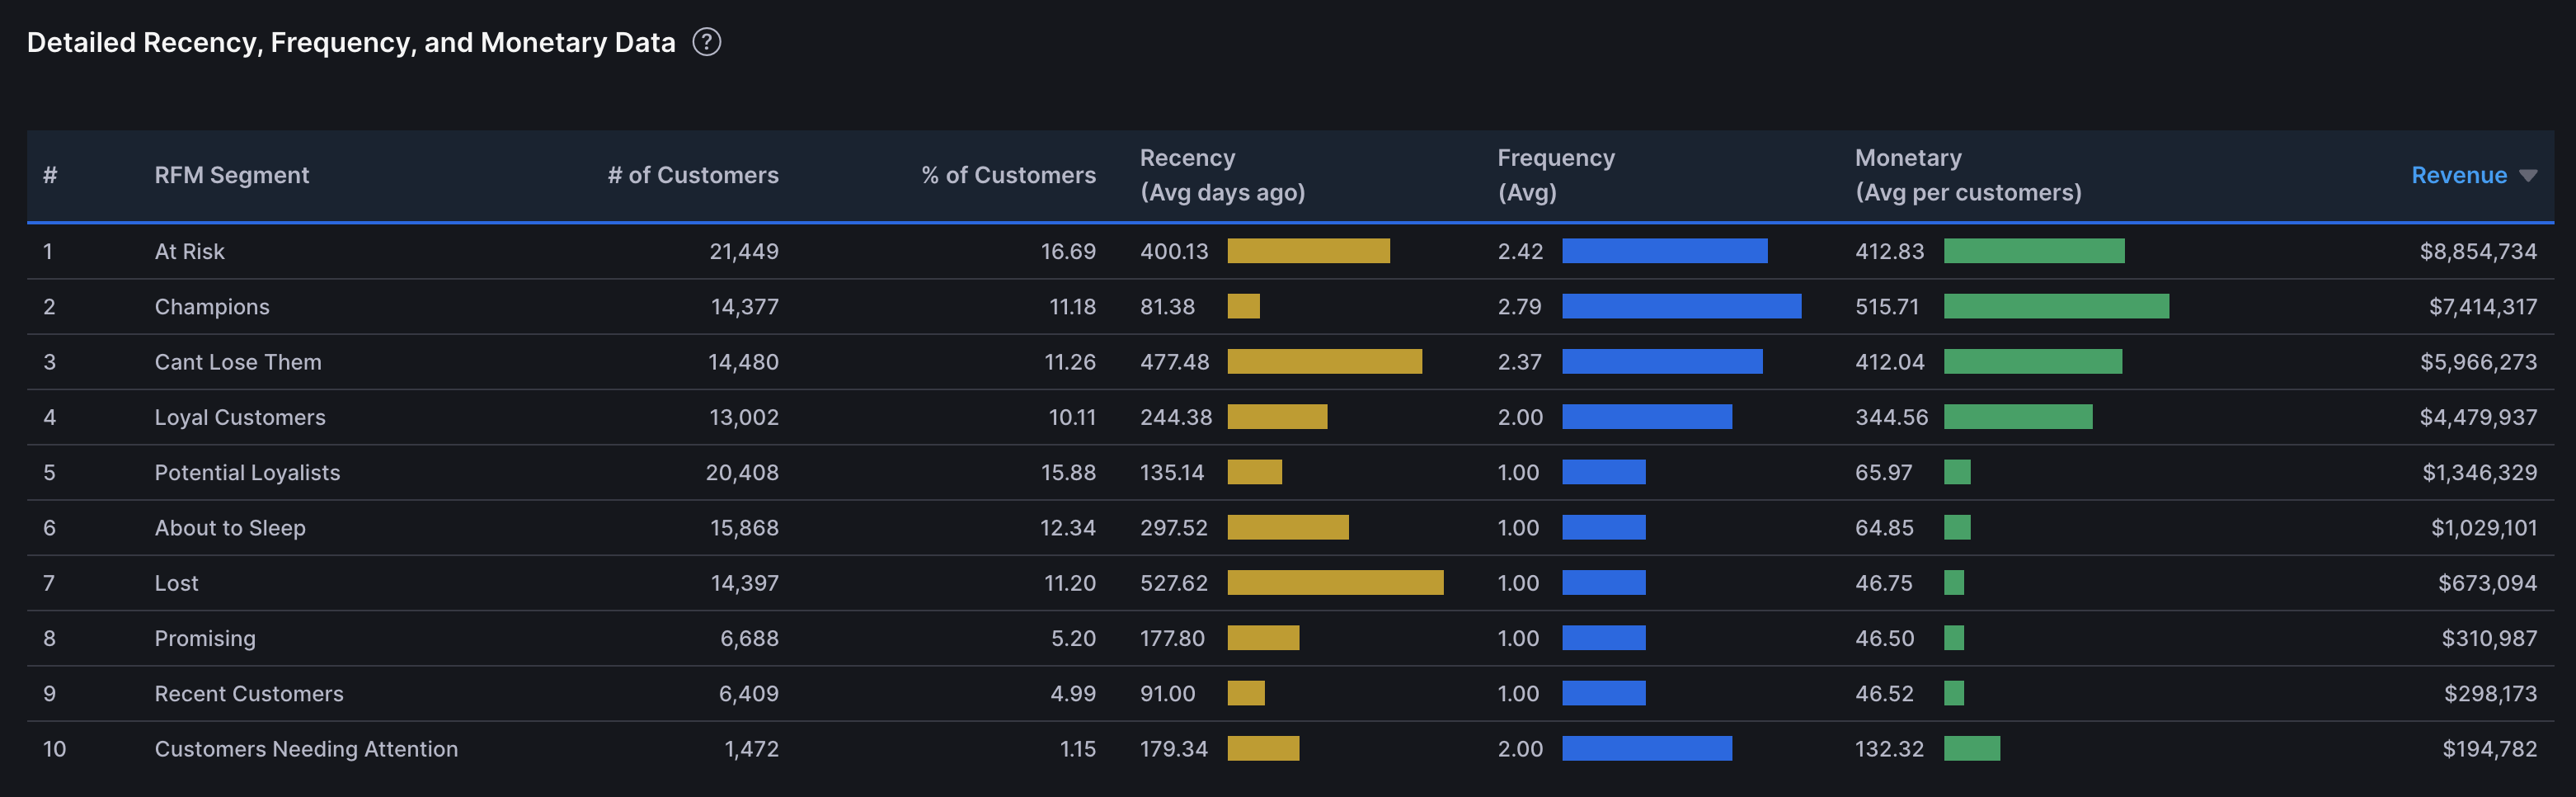
What is RFM?
Let’s breakdown RFM and why this acronym is so powerful:
R - recency (how recent your customers buy)
F - frequency (how frequent your customer buy)
M - monetary (how much your customers buy $$)
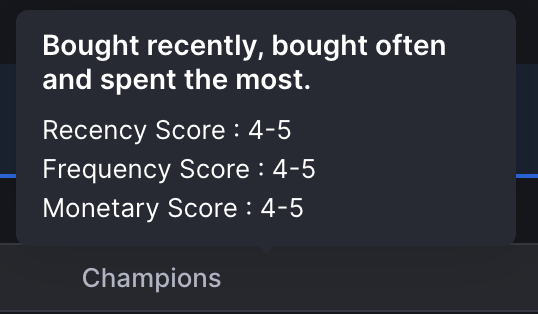
With each factor scored from 1 to 5—the higher the score, the better.
An audience with a score of 5-5-5, you might consider, a Champion. Conversely, a score of 1-1-1, would be considered a …well…someone you wouldn’t want to spend money on. Different RFM scores equate to different audience segments, which in turn, unlock levels of personalization.
You’re looking for customers ready to purchase, willing to buy again, and with money to spend. AdBeacon gives you a powerful way to find them, of course, using 1st party data.
What do I do with RFM?
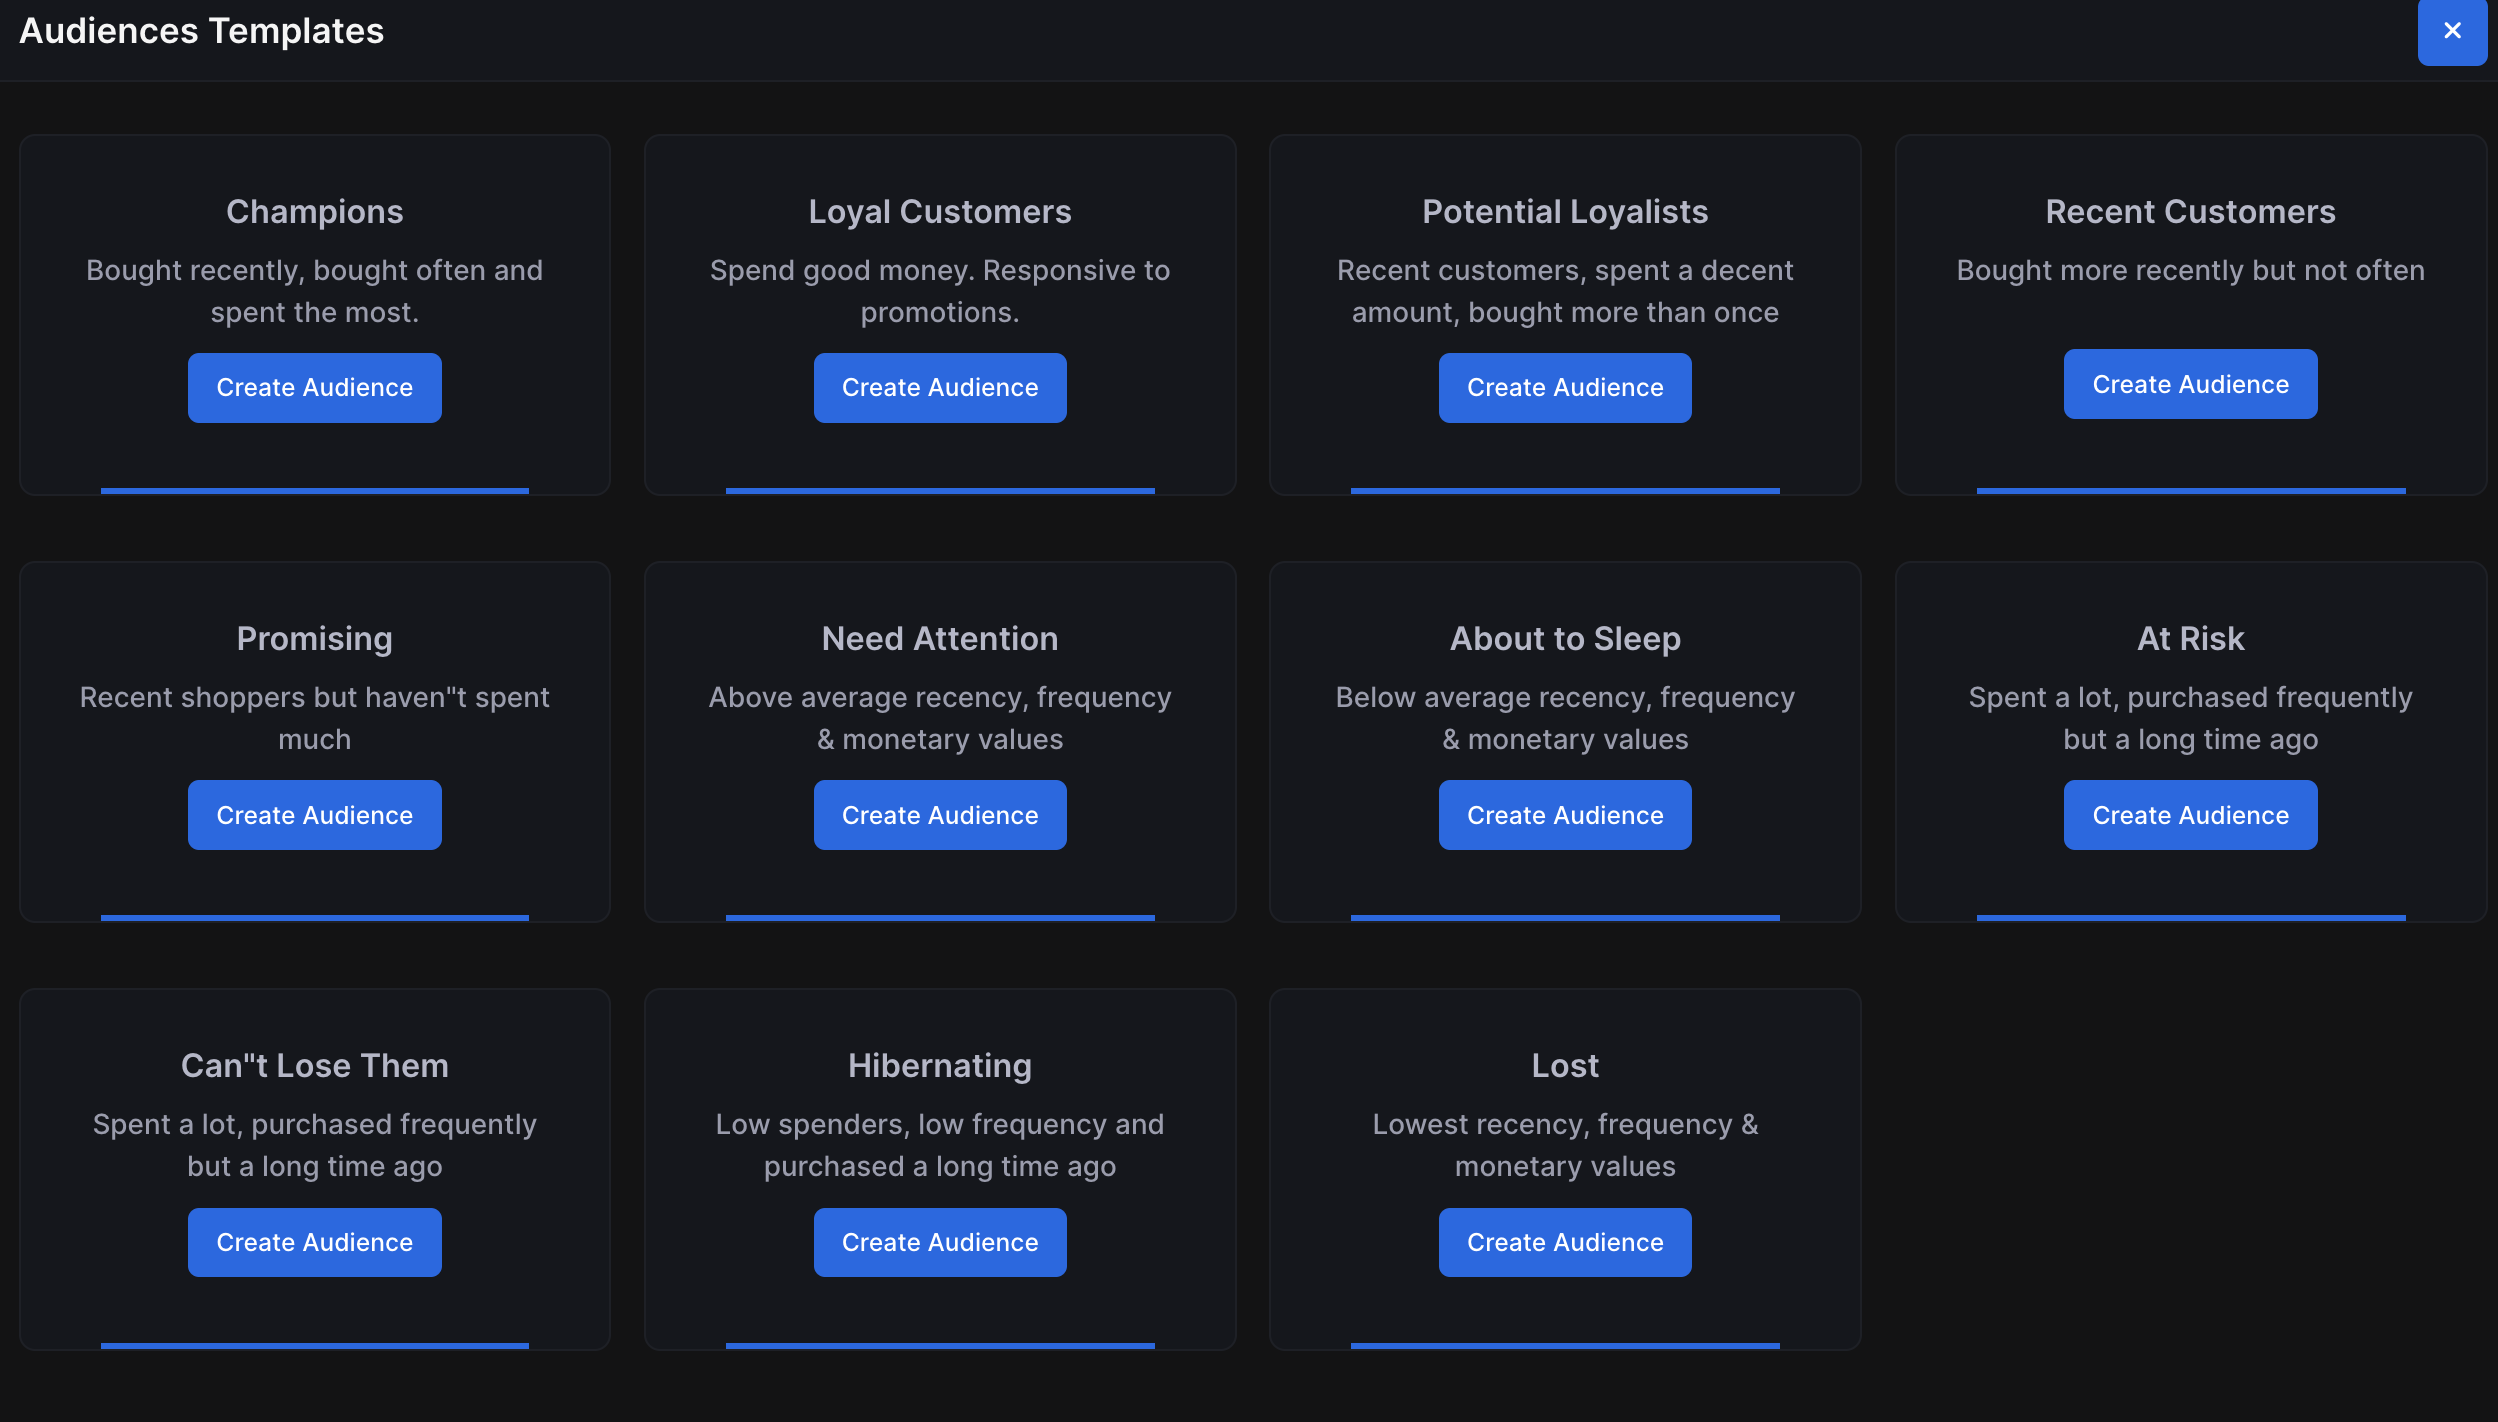
The first step is the read the data to best understand where the majority of your customers sit. Once those segments are identified, now it’s time to get to work. Head over to our Audience Builder - here, we’ve prebuilt your RFM segments into audiences for testing. Make sure to select “Create” and the audiences will begin to populate.
Consider activating these segments directly in your media buying.
To maximize LTV, speak to selected segments directly through the best channels that reengage with existing customers.
To reduce CPA, exclude your worst segments to prevent paying your worst customers again and again.
To find more of your best customers, create lookalike audiences based on your top segments.
How to maximize LTV with RFM?
- Now that you have your audiences, analyze where the majority of your customers live and areas of opportunities to bump them to a higher tier of RFM. How do we move your potential loyalists (RFM score 2-3-2), into the loyal customer segment (RFM score 4-4-4)? Messaging, exclusive offers and upsell flows that are specific to their needs.
- Then, directly integrate your RFM audiences into your marketing channels and watch the rate in which they grow/shrink.
- Next, identify which channels acquire the best/worst RFM segments to know where to spend your advertising budget. Find your best customers via RFM so you can put more budget where it matters most - Champions and Loyalists. You can also exclude low scoring segments from your advertising to prevent ad spend bleed.
- Lastly, don’t forget about retention of your high scoring customer segments.
Questions to ask yourself:
How are you maintaining, if not growing these categories?
What strategies are in place to keep them engaged and feeling valued?
Are you treating them differently than your lower scoring segments?
Do they have exclusivity perks for being your best customers?
As the DTC landscape gets trickier to navigate, it’s clear that loyalty (LTV) is the new currency in 2024, and it starts with RFM.
Orders
Orders
Here, you’ll be able to filter through all customers who have purchased from you. This data is directly pulled from your ecommerce store and is available at your fingertips. Pinpoint specific customers, their journeys, orders, return history and so much more.
How long does it take a customer to buy from a channel on average?
- To discover this information, click on the Time Analysis tab (Main left navigation menu > Reports > Orders > Time Analysis Tab)
- Customer journey lengths are calculated by first click data and how long it takes on average a customer to buy from your store from the first initial interaction
- The customer buying journey varies from platform/channel to platform/channel. Discover the average length of time it takes to acquire a customer from each source/medium to make the best decisions for your business.
.png)
- To discover this information, click on the Time Analysis tab (Main left navigation menu > Reports > Orders > Time Analysis Tab)
What are the best hours/days/months that customers buy?
- To discover this information, click on the Time Analysis tab and scroll to the bottom. (Main left navigation menu > Reports > Orders > Time Analysis Tab > Scroll to bottom of the report)
- Be sure to filter by your preferred timeframe (hour/day/month)
.png)
- Here, you’ll be able to analyze revenue vs volume of orders by the selected filter to best identify what your optimal time frames are for your goals (Example Below from “Hours of the Day)
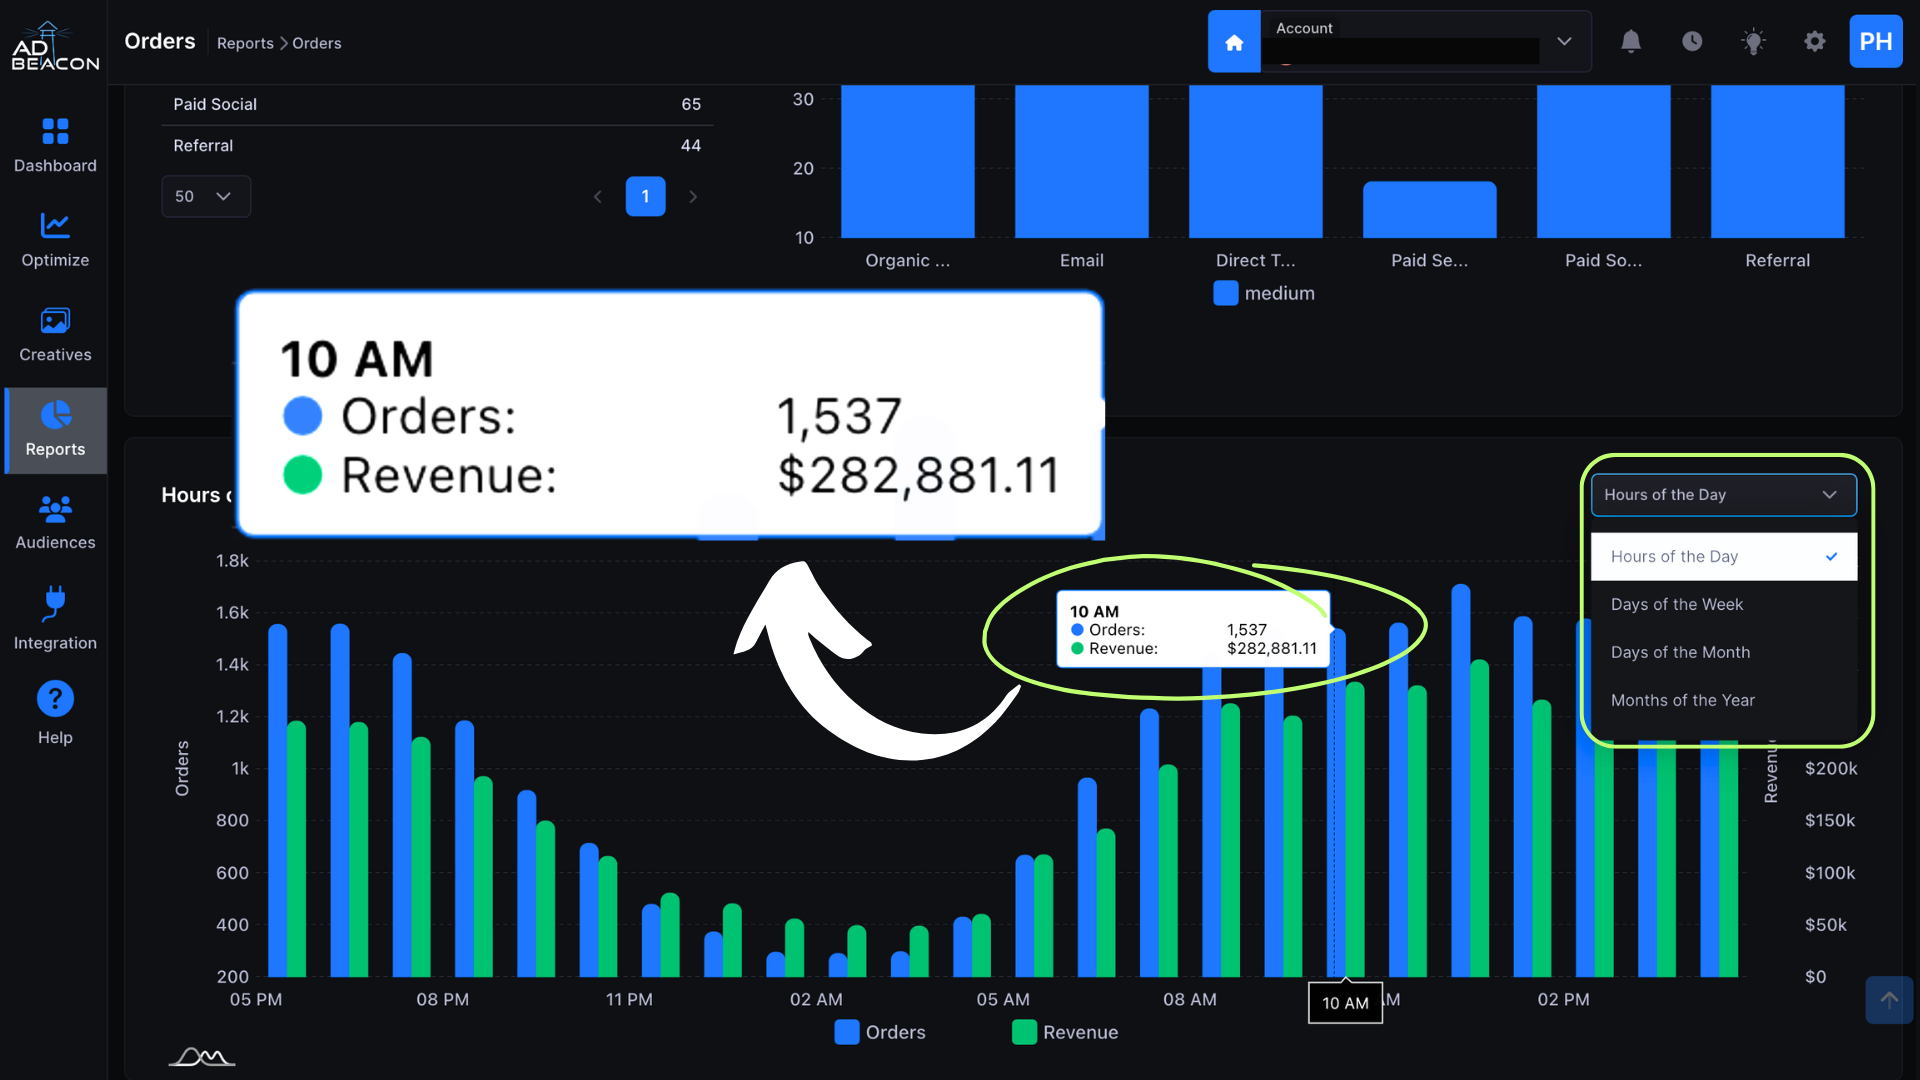
- To discover this information, click on the Time Analysis tab and scroll to the bottom. (Main left navigation menu > Reports > Orders > Time Analysis Tab > Scroll to bottom of the report)
What coupon codes drive the most revenue vs volume of orders?
- Whether it be offers, affiliates, influencers or featured promotions - understanding their impact is important.
- While still working in the “Orders” Report - Navigate to the “Coupon Code” tab to unveil an in-depth analysis as to which coupon codes are driving the greatest impact to your e.
- (Main left navigation menu > Reports > Orders > Time Analysis Tab > Coupon Code Tab)
.png)
- Whether it be offers, affiliates, influencers or featured promotions - understanding their impact is important.
Sales & Leads
What is my average order value?
- To determine whether your marketing strategies to increase order value are working, check the AOV report under the Sales & Leads section of AdBeacon
- (Main left navigation menu > Reports > Orders > Sales & Leads)
- Here, you can analyze the trend line within a 3 month period of time to see how the business is trending and if your team is pacing to your goal.
.png)
- To determine whether your marketing strategies to increase order value are working, check the AOV report under the Sales & Leads section of AdBeacon
How frequently do my customers buy?
- It’s important to understand (on average) how many times a customer will purchase within a certain amount of time.
- To best analyze this, see the customer frequency report in AdBeacon. (Main left navigation menu > Reports > Orders > Sales & Leads > Scroll to Bottom of the Report)
- Ask yourself, what is the percentage of customers that buy 1, 2, 3, 4 or even 5+ orders?
- Then, consider creating strategies to increase this frequency if it appears lower than desired.
.png)
Customer Geography
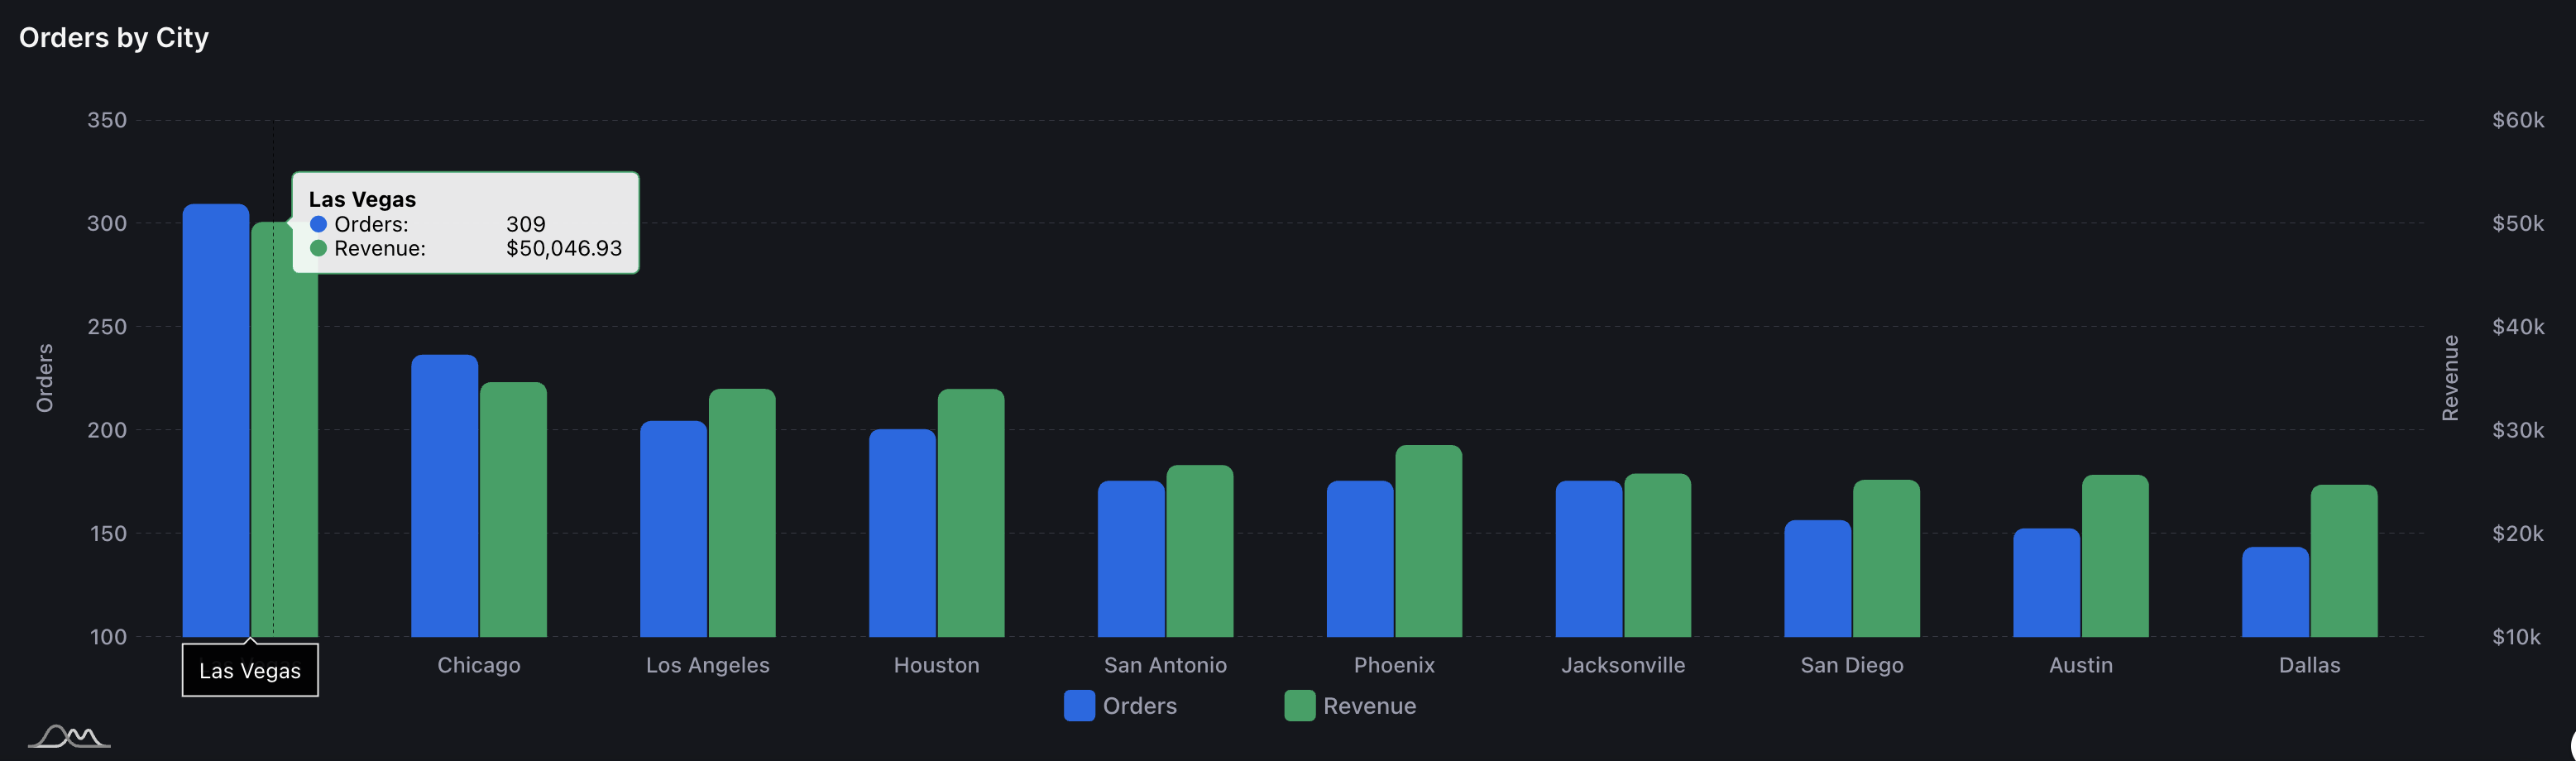
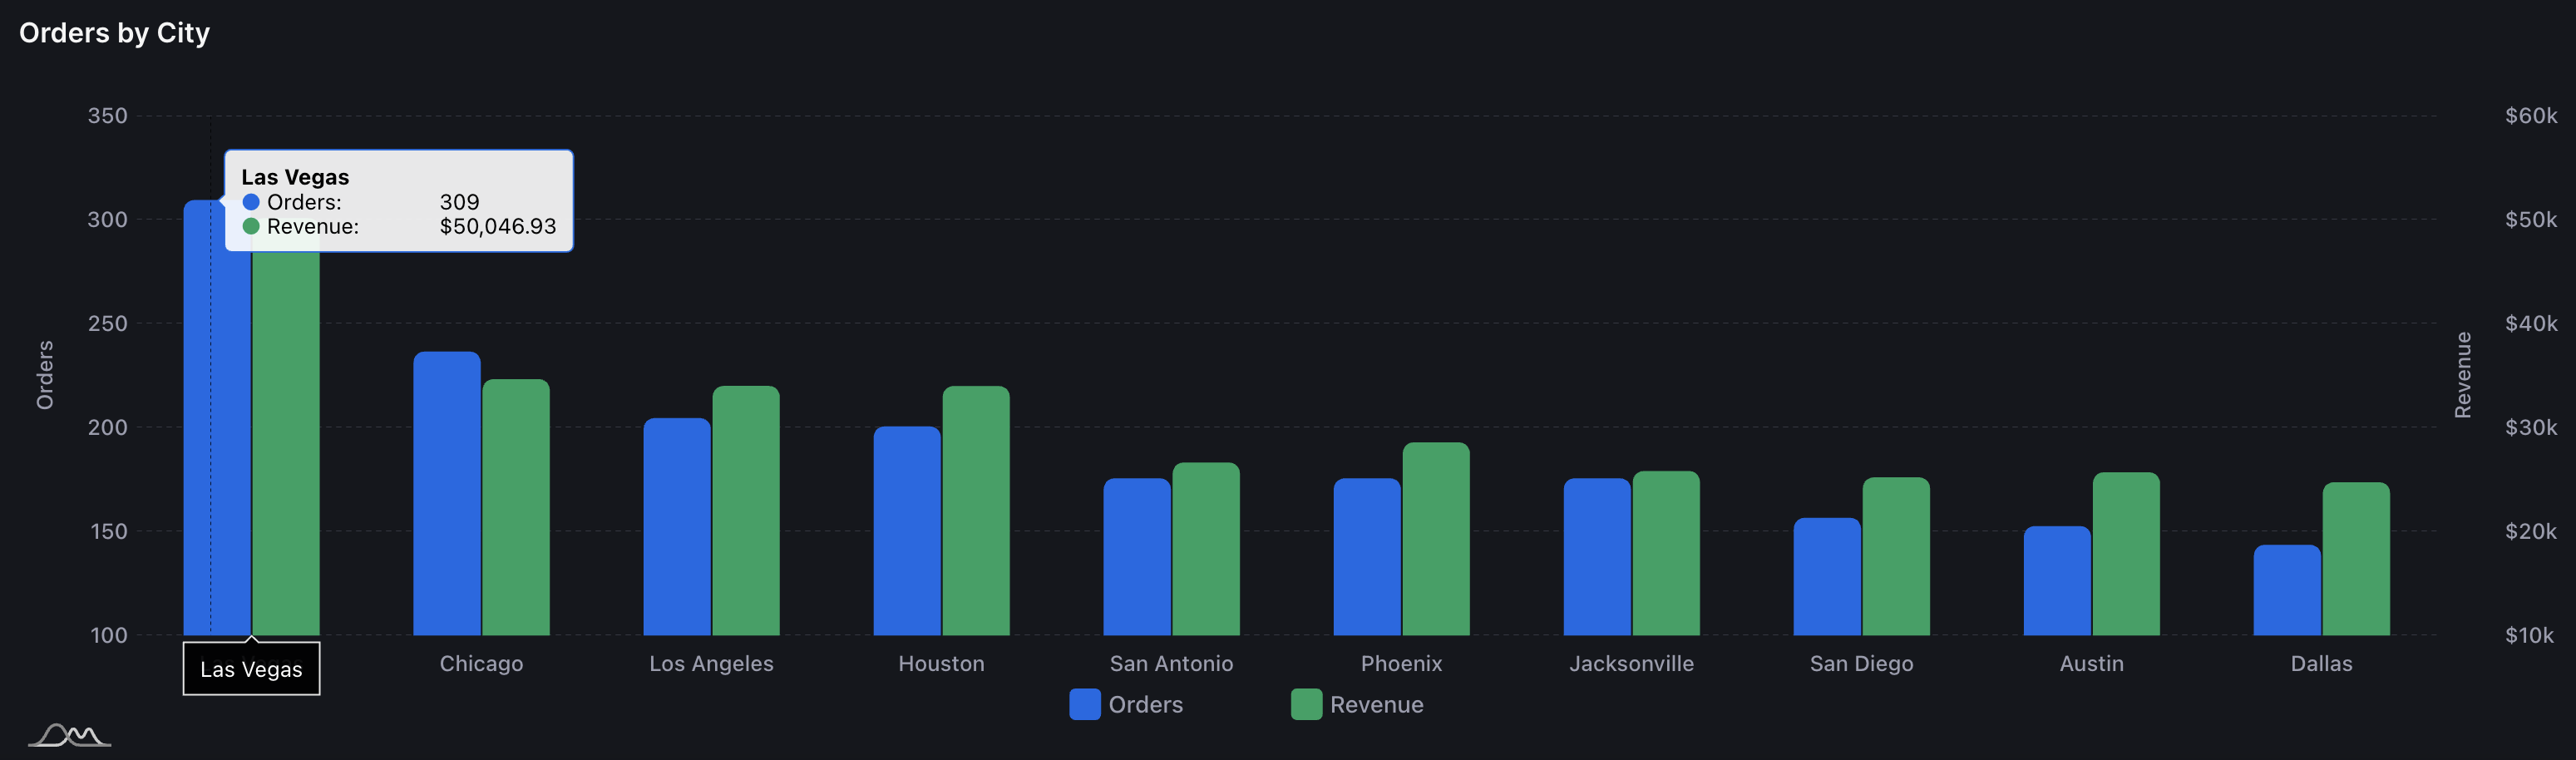
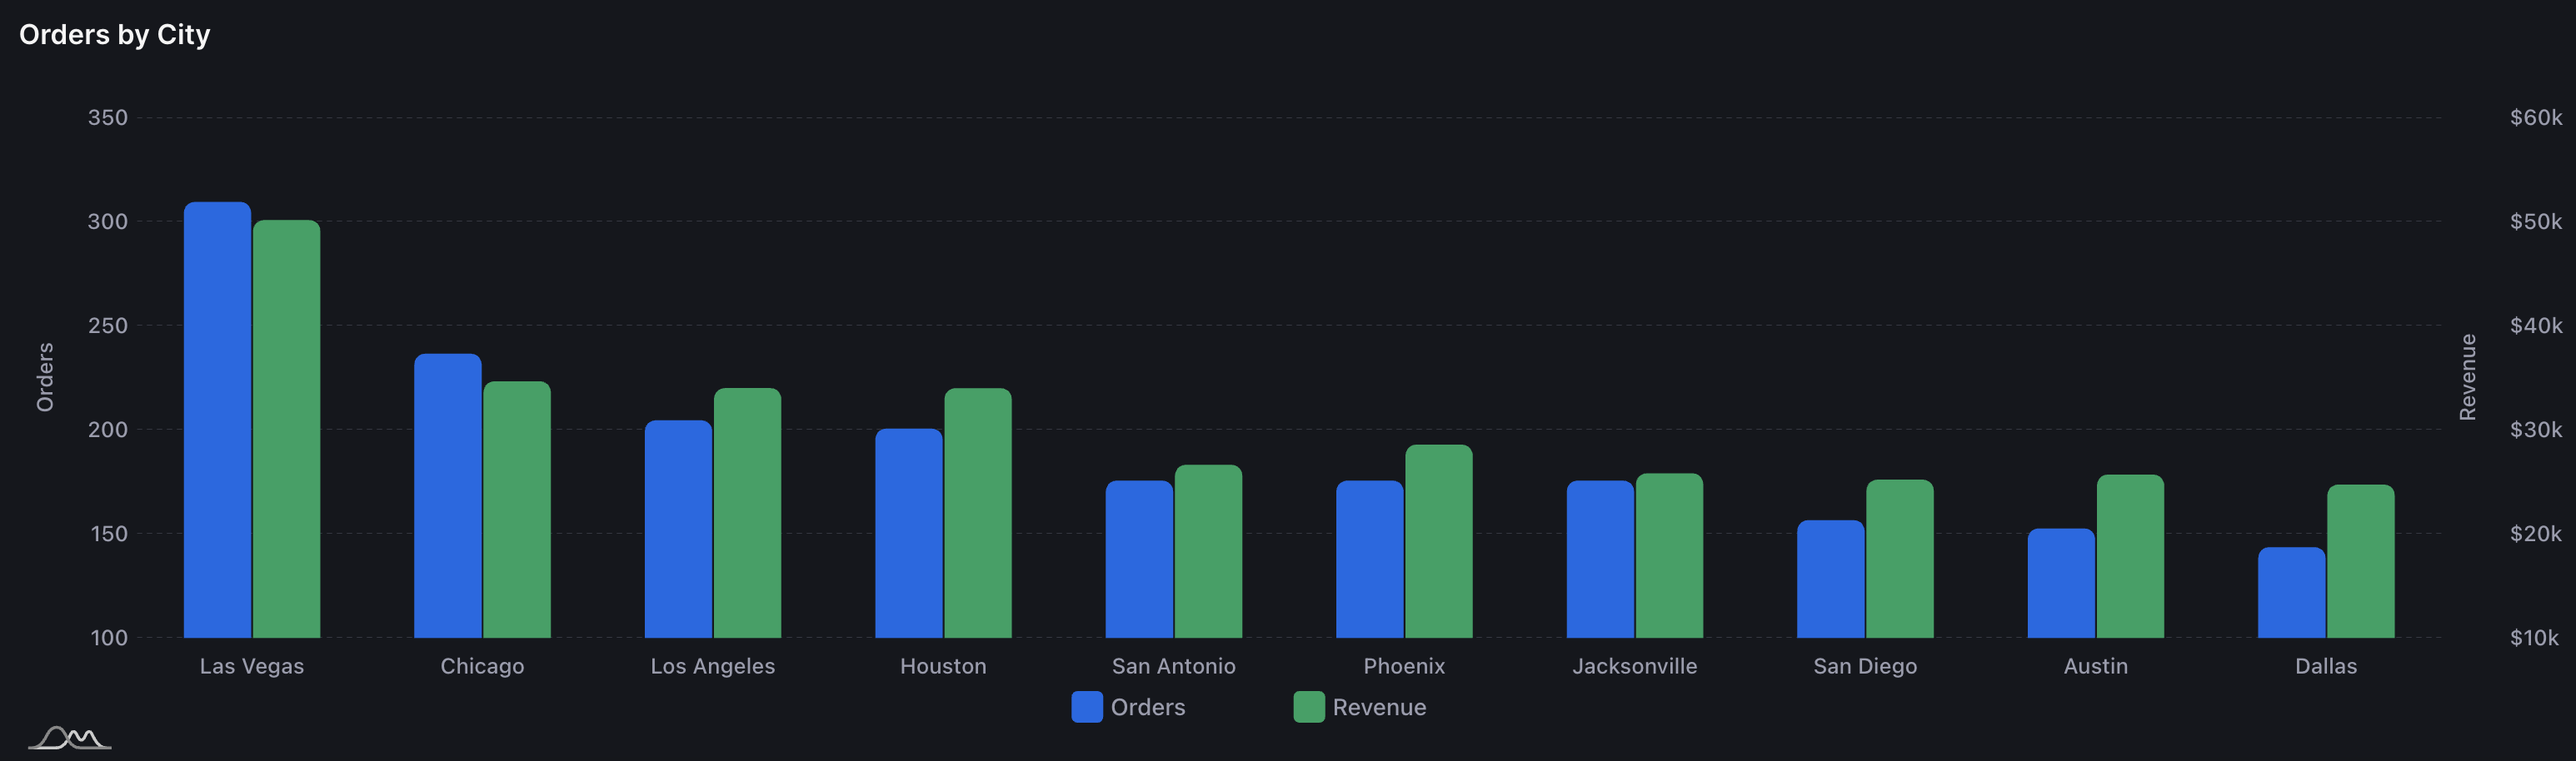
AdBeacon has done the hard work for you. Here, we’ve consolidated your customer data to best unveil your top cities that show the most promise/potential. We’ve filtered by two metrics, revenue (green) and volume of orders (blue) for you to best make decisions based on your goals.
What cities bring me the most revenue?
- To identify which cities drive the most revenue, click on the Customer Geography report and see which cities have the highest bar of green. These cities have been aggregated to showcase the most revenue within the selected time frame.
- To identify which cities drive the most revenue, click on the Customer Geography report and see which cities have the highest bar of green. These cities have been aggregated to showcase the most revenue within the selected time frame.
What cities drive the most orders?
- To identify which cities drive the most volume of orders, click on the Customer Geography report and see which cities have the highest bar of blue. These cities have been aggregated to showcase the most revenue within the selected time frame.
- To identify which cities drive the most volume of orders, click on the Customer Geography report and see which cities have the highest bar of blue. These cities have been aggregated to showcase the most revenue within the selected time frame.
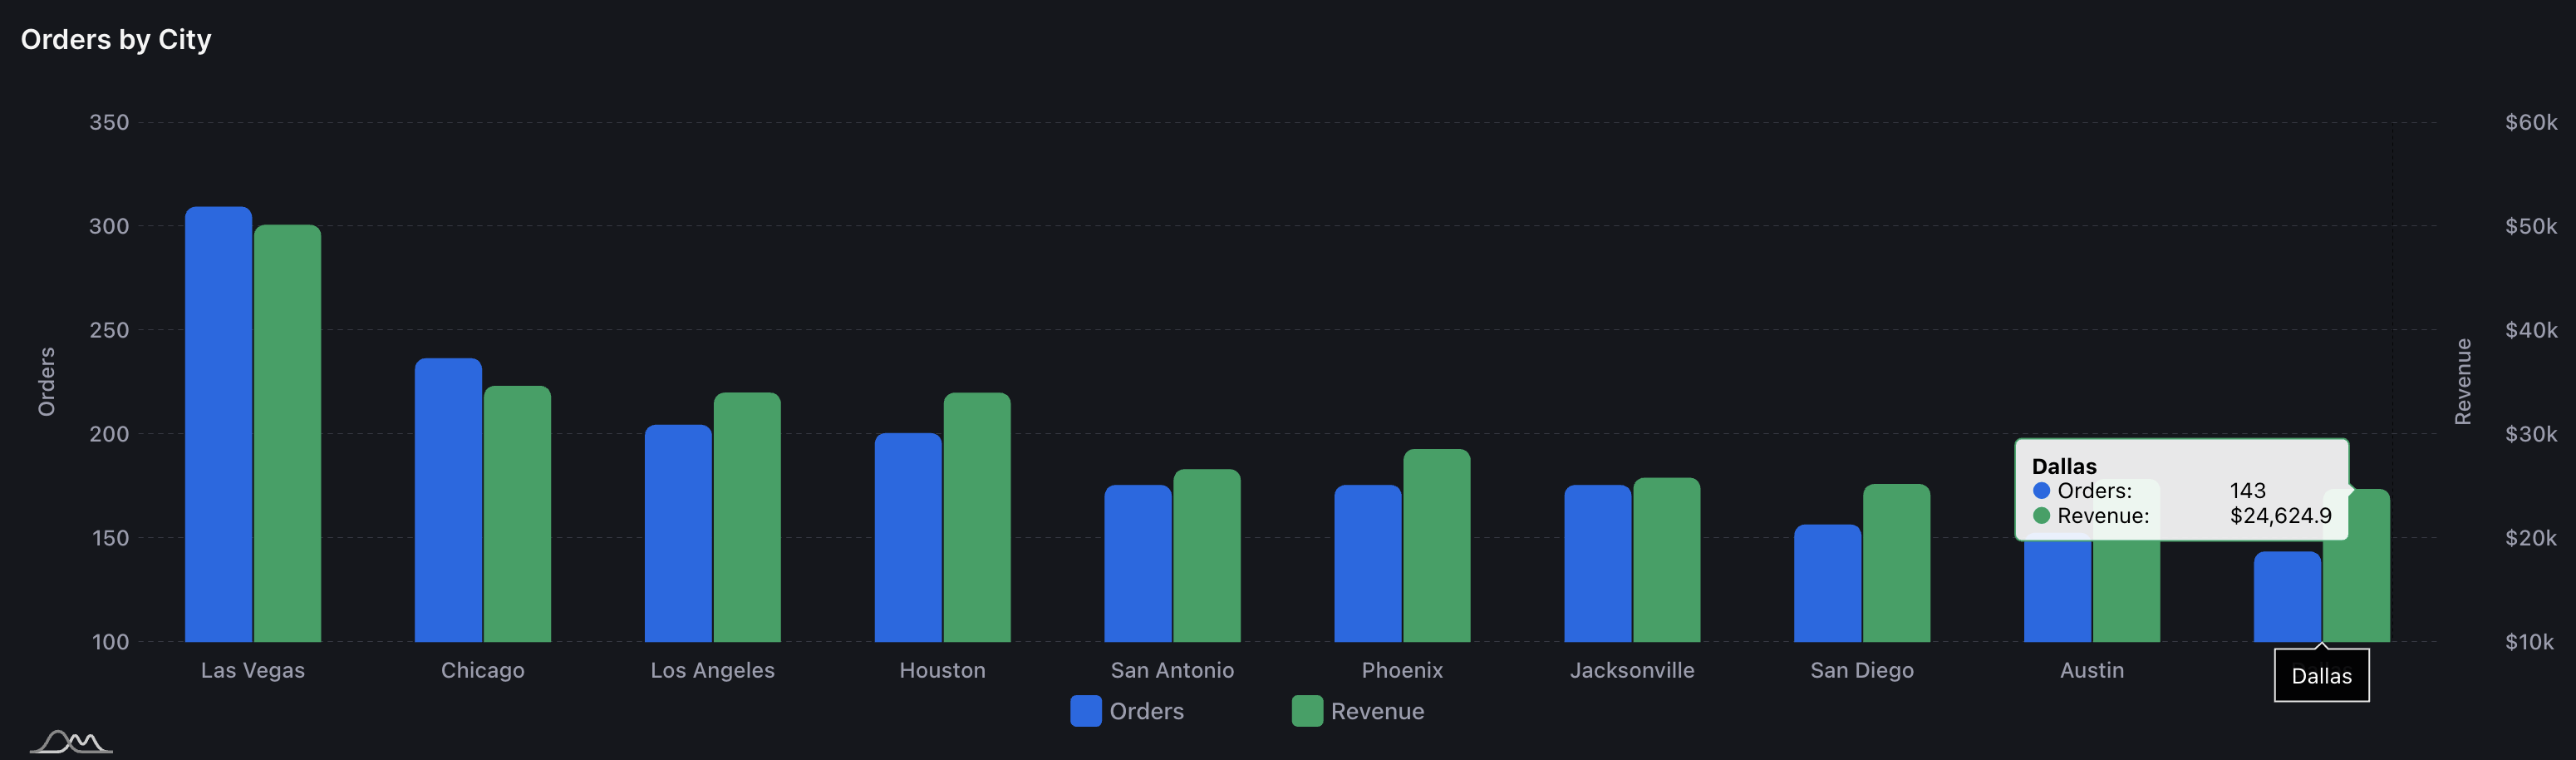
What cities should I spend money in?
The cities listed in the Customer Geography report are the top cities your team should consider targeting directly for the highest opportunity for immediate sales. Based on the data, AdBeacon shows that these cities are where your buyers thrive - double down on these efforts!
What cities should I start testing in?
Consider allocating budget towards cities that drive far more revenue (green) than volume of order (blue). This can be an indication that those cities have more buying power.
Products
It’s important to not only understand what products customers are buying from you, but to anticipate what they’ll most likely buy next.
AdBeacon aggregates your customer data to predict what products are most likely to be bought next based on customer/purchase behavior in the selected timeframe.
Below, we’ll show you how to read the product journey report to unlock upsell flows and unveil key opportunities for actionable insights.
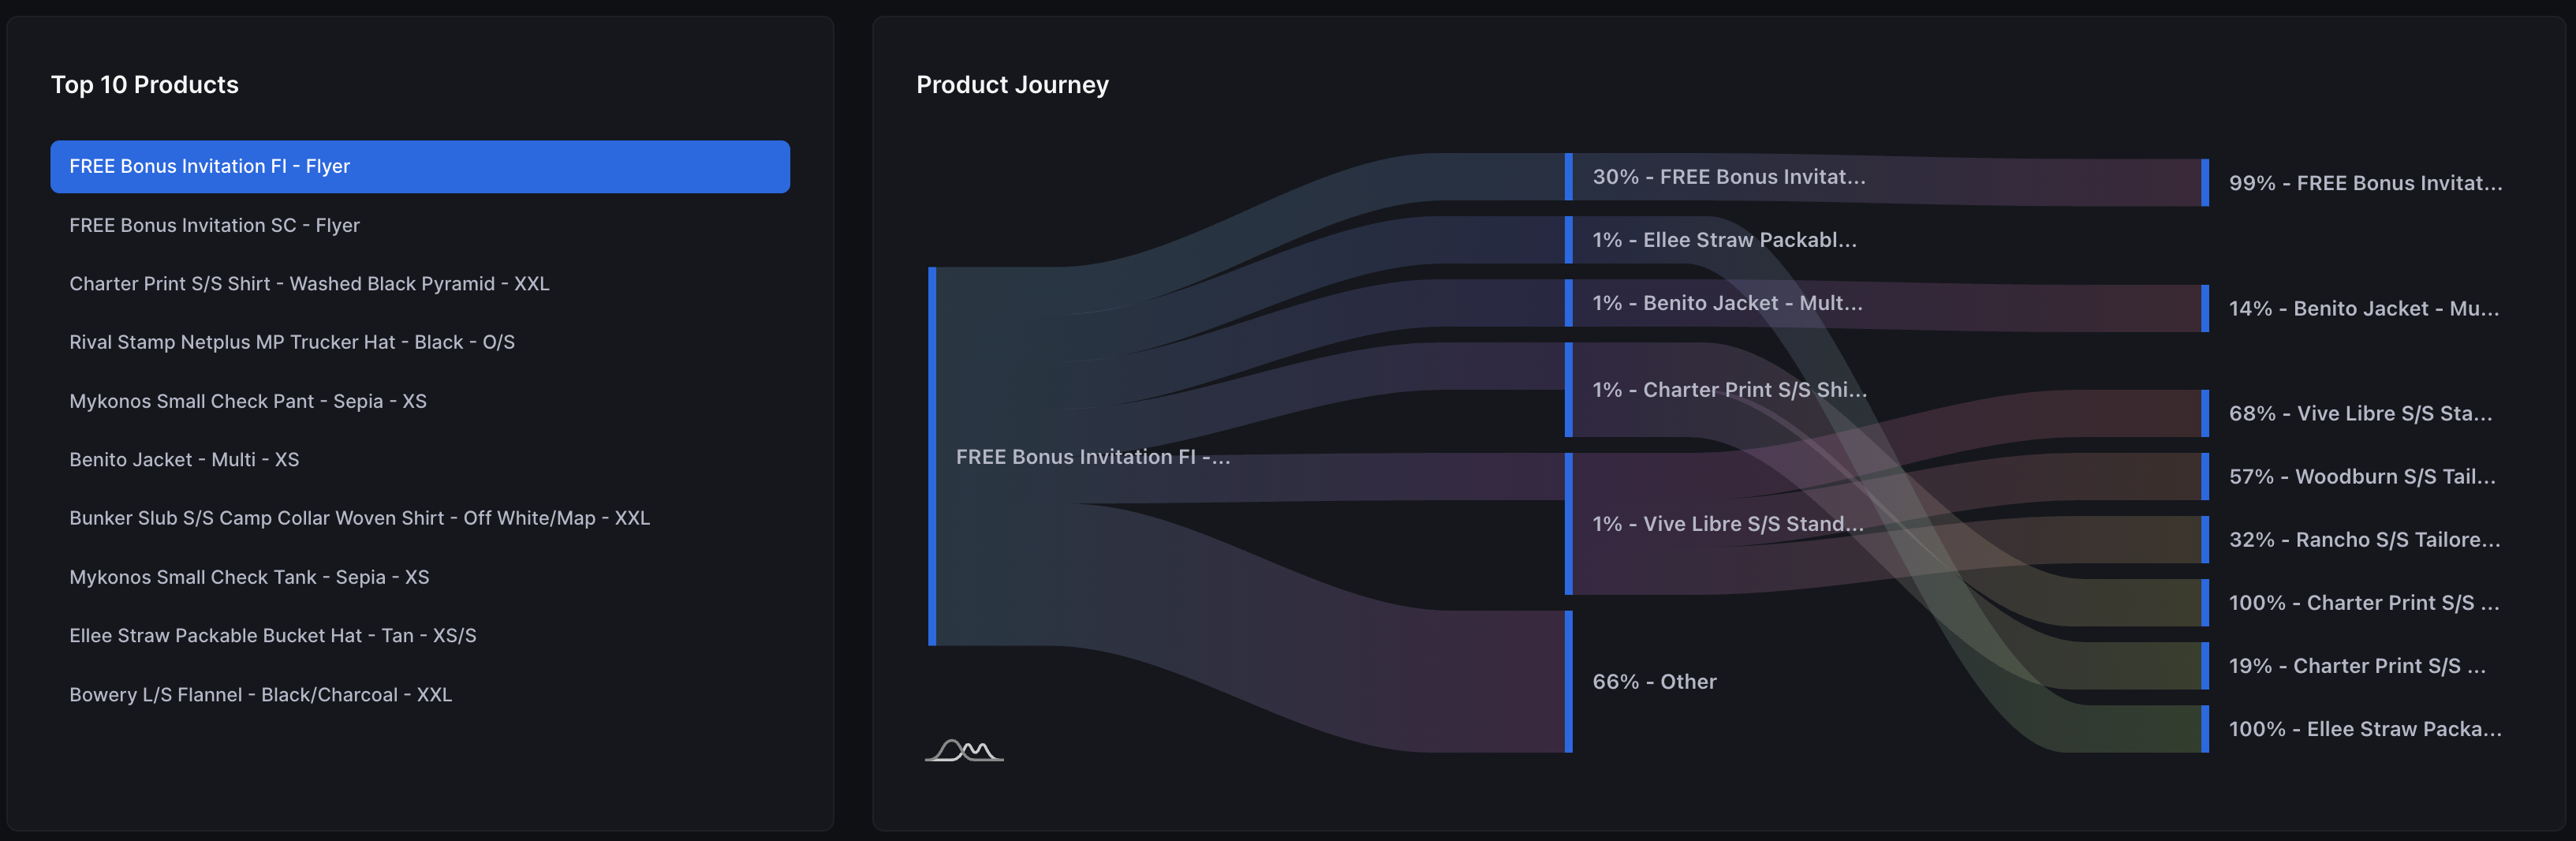
Product Journey Report
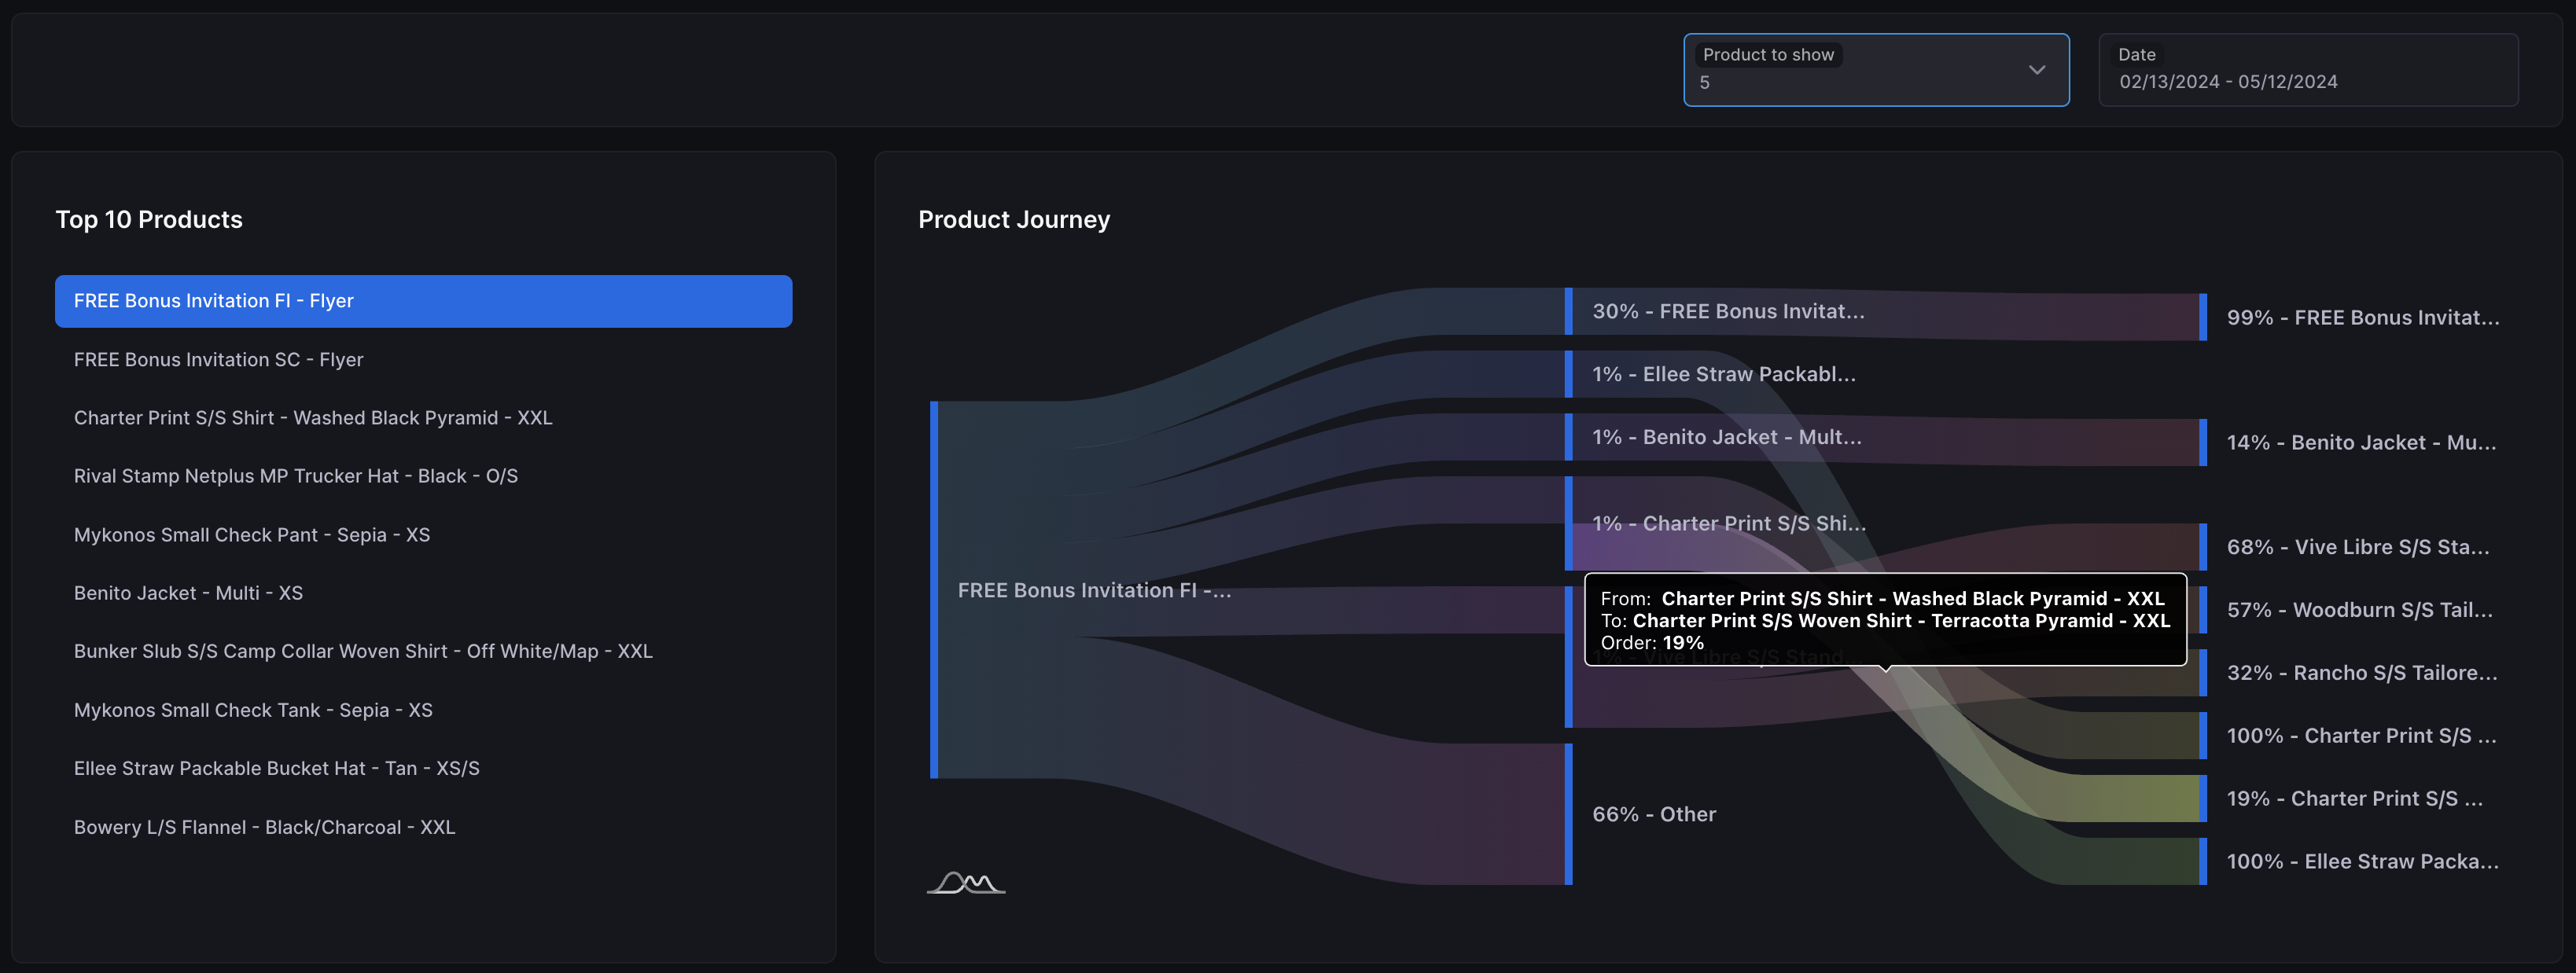
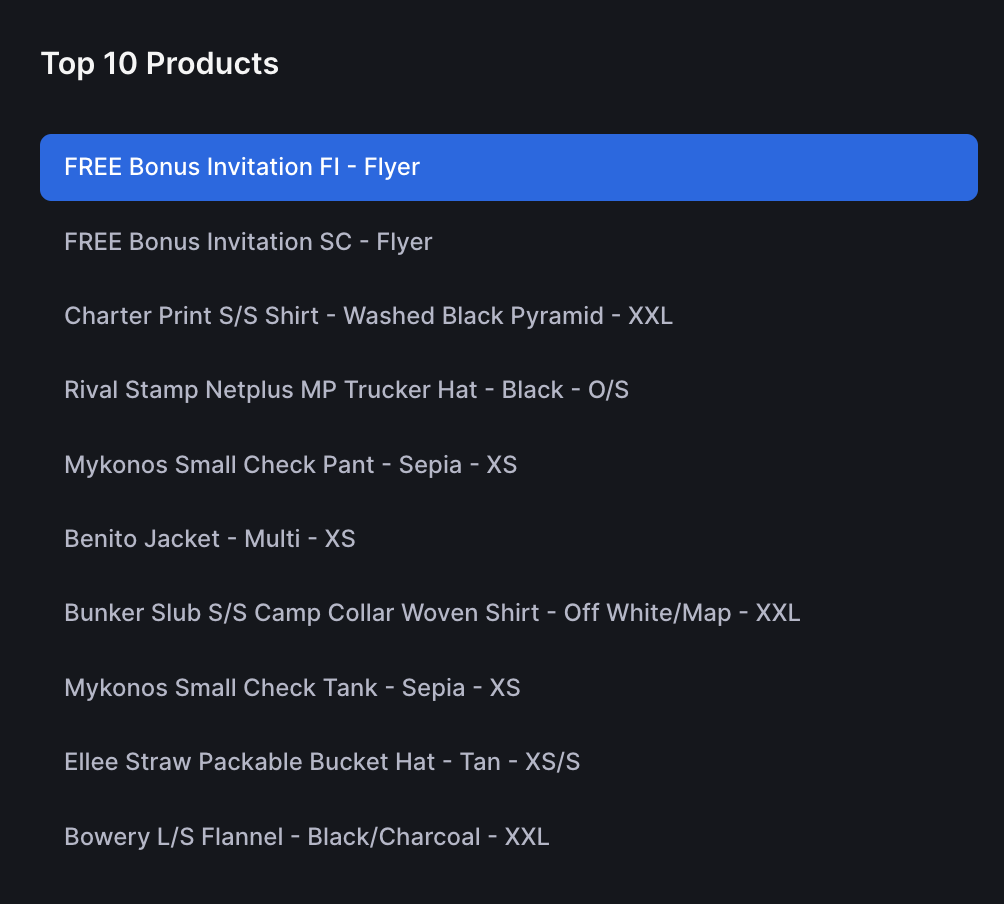
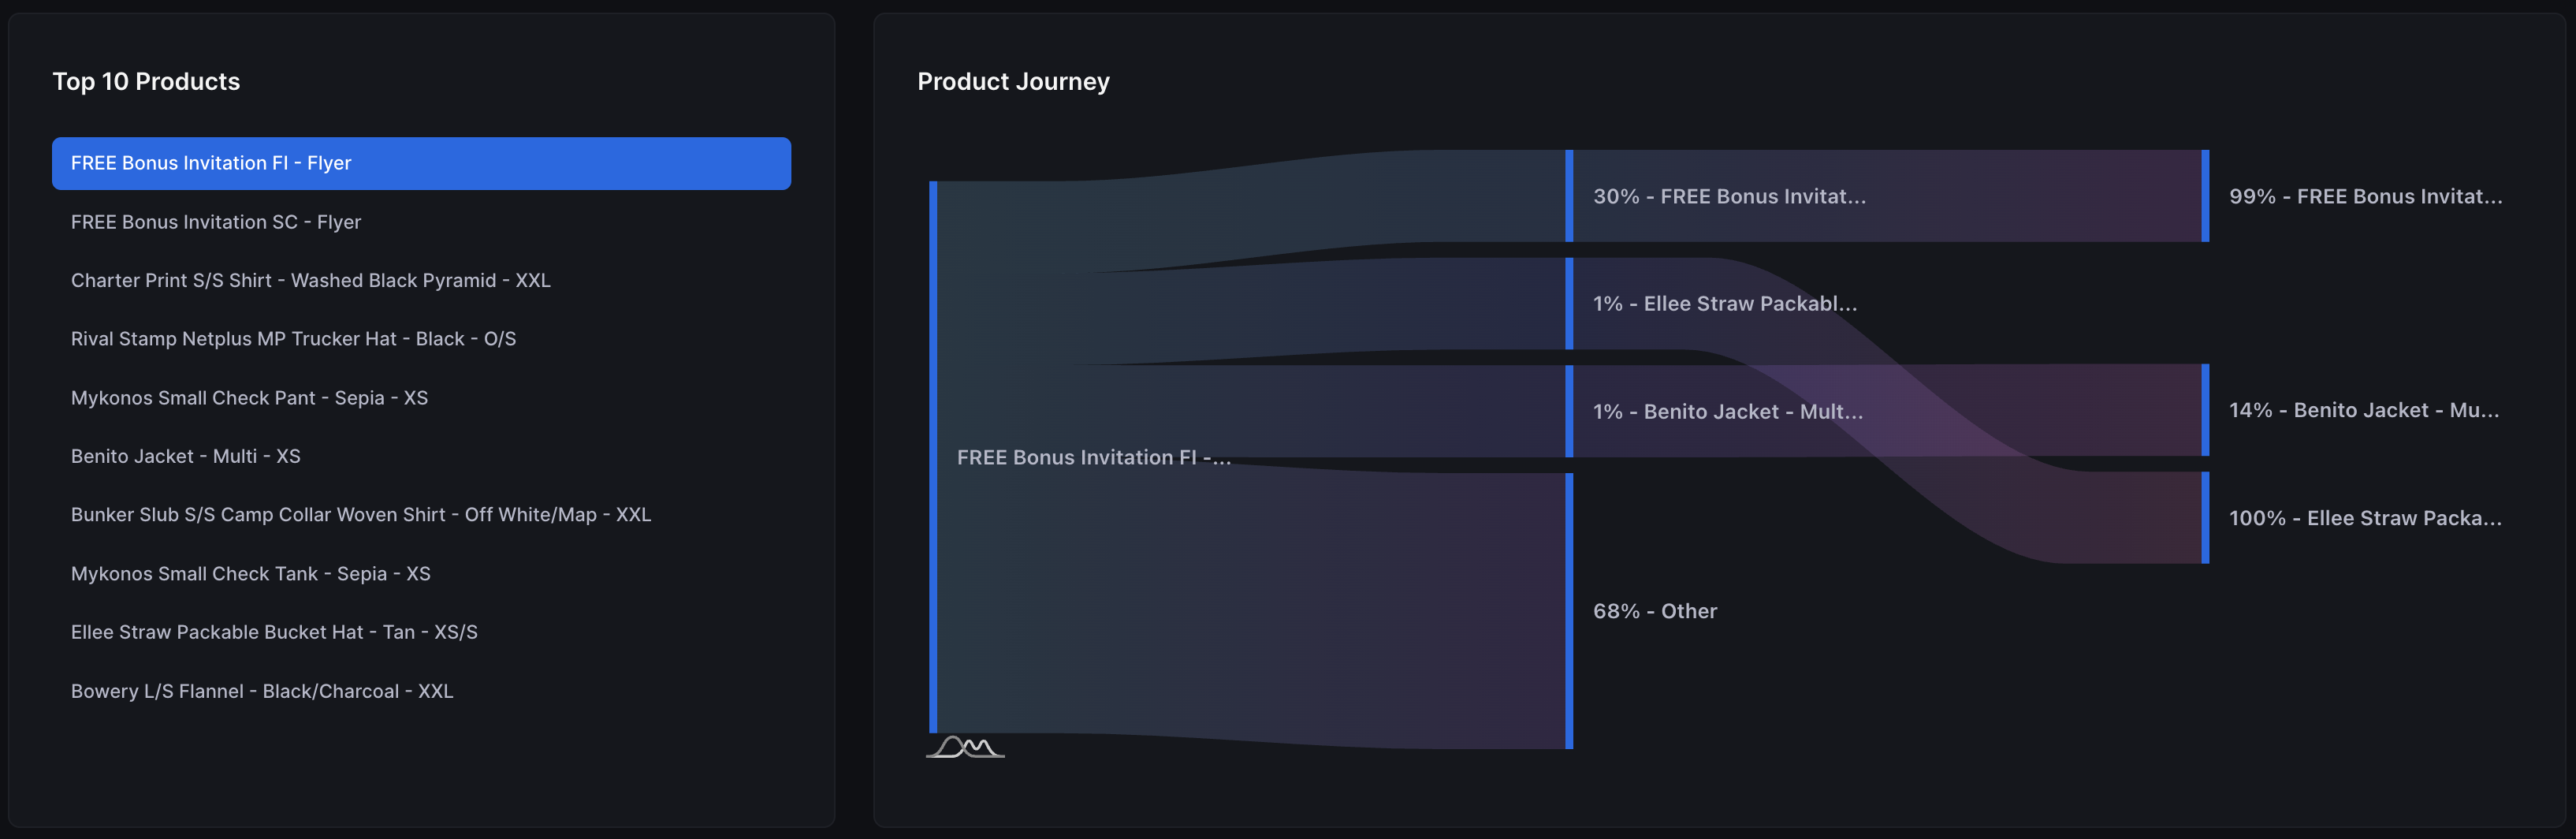
Here, you’ll be able to analyze the top 10 products sold - be sure to adjust desired date in the upper right hand corner.
Based on historical customer data and purchase behavior, AdBeacon presents what products customers are most likely to buy. This feature unlocks custom upsell flows based on product to help drive higher LTV and retention.
How to read the product journey report
On the far left side, AdBeacon presents the top 10 products sold within the selected time frame.
When analyzing your top products, we encourage your team to ask these questions:
- Is there a trend in sizing that customers are buying?
- Are there specific products that have strong margins you can double down on?
- Do specific products lead to male vs female products?
- Are the products being bought next a different size? If larger, why? If smaller, why?
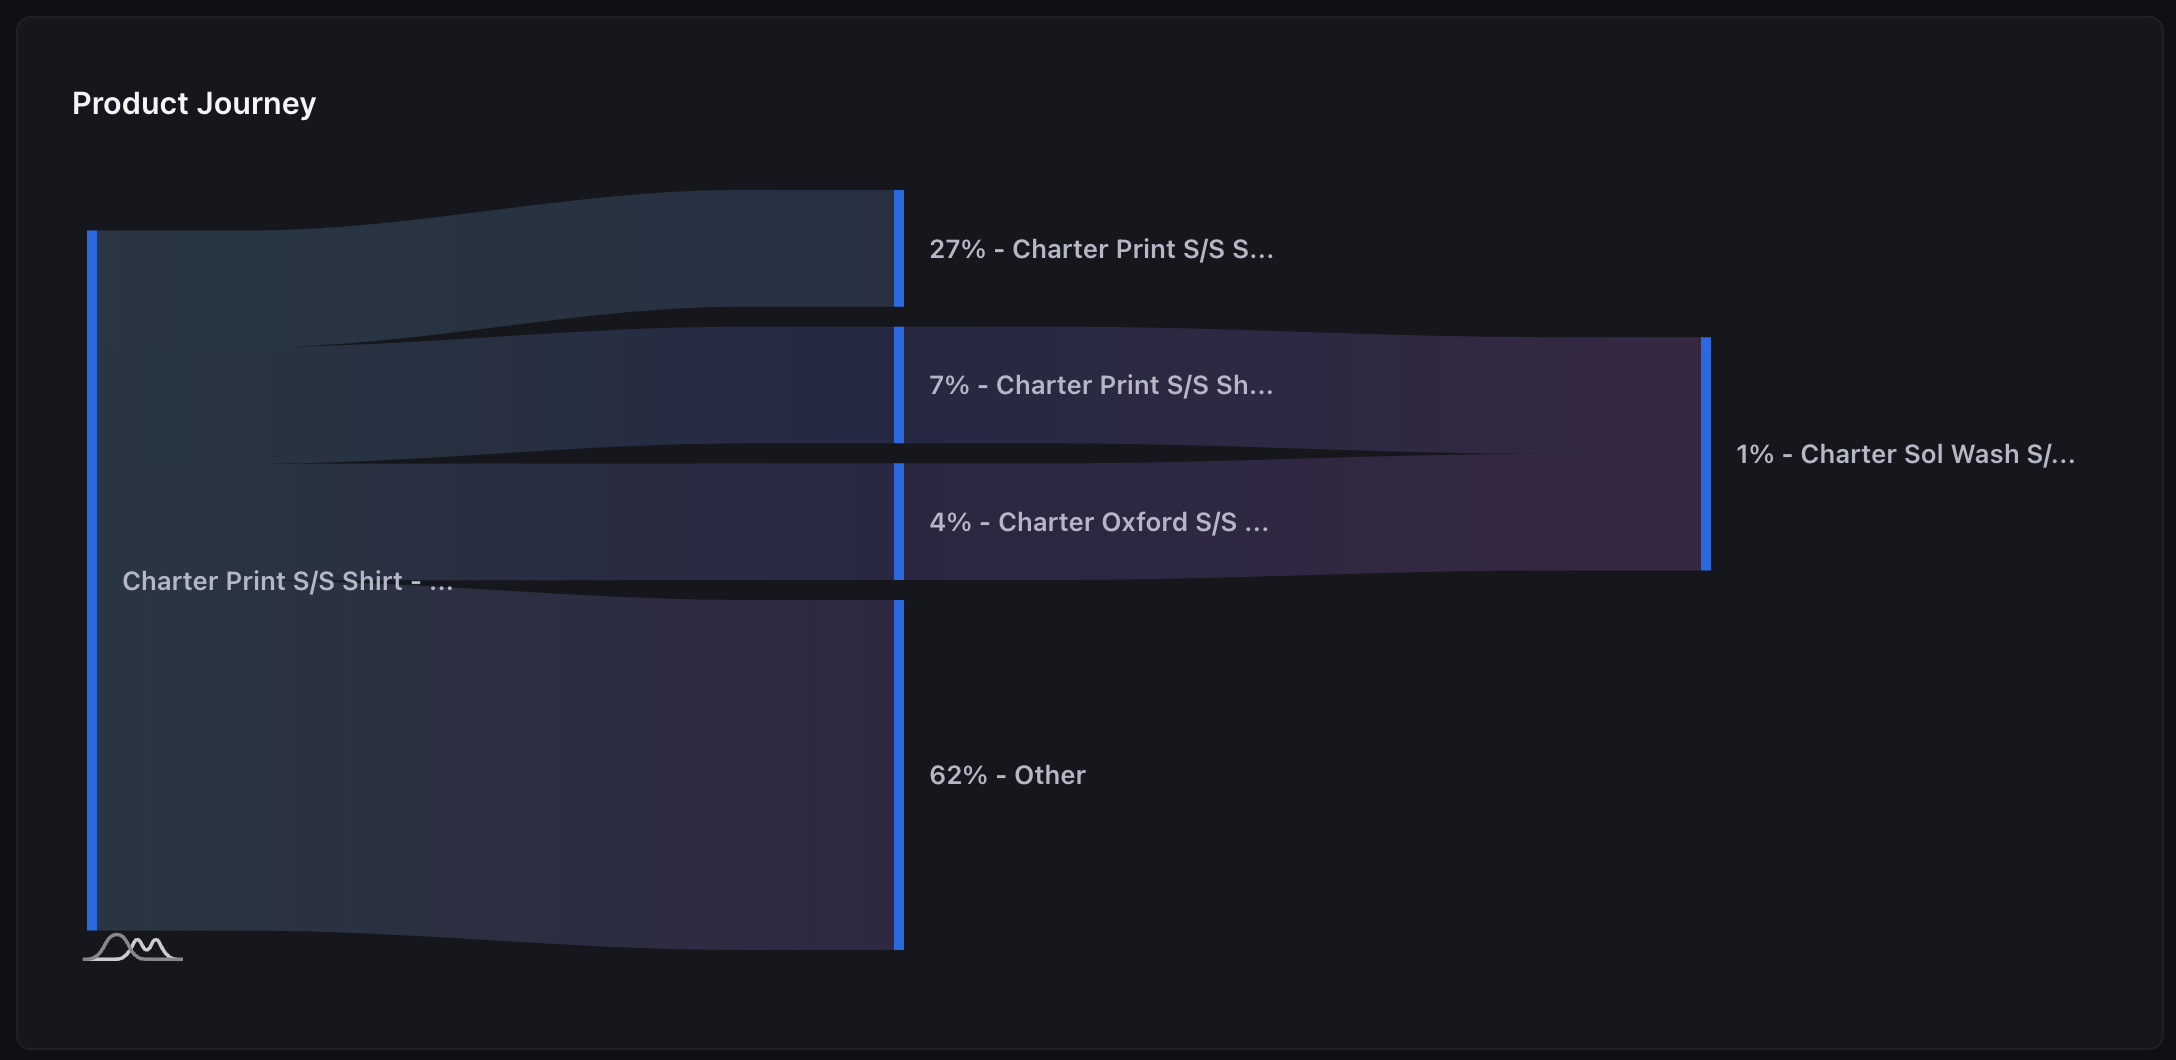
On the far right side, AdBeacon presents what products customers have bought next from their initial purchase. To best read this data, the top row shows the percentage of customers that did not buy another product again after their first purchase (within the selected time range).
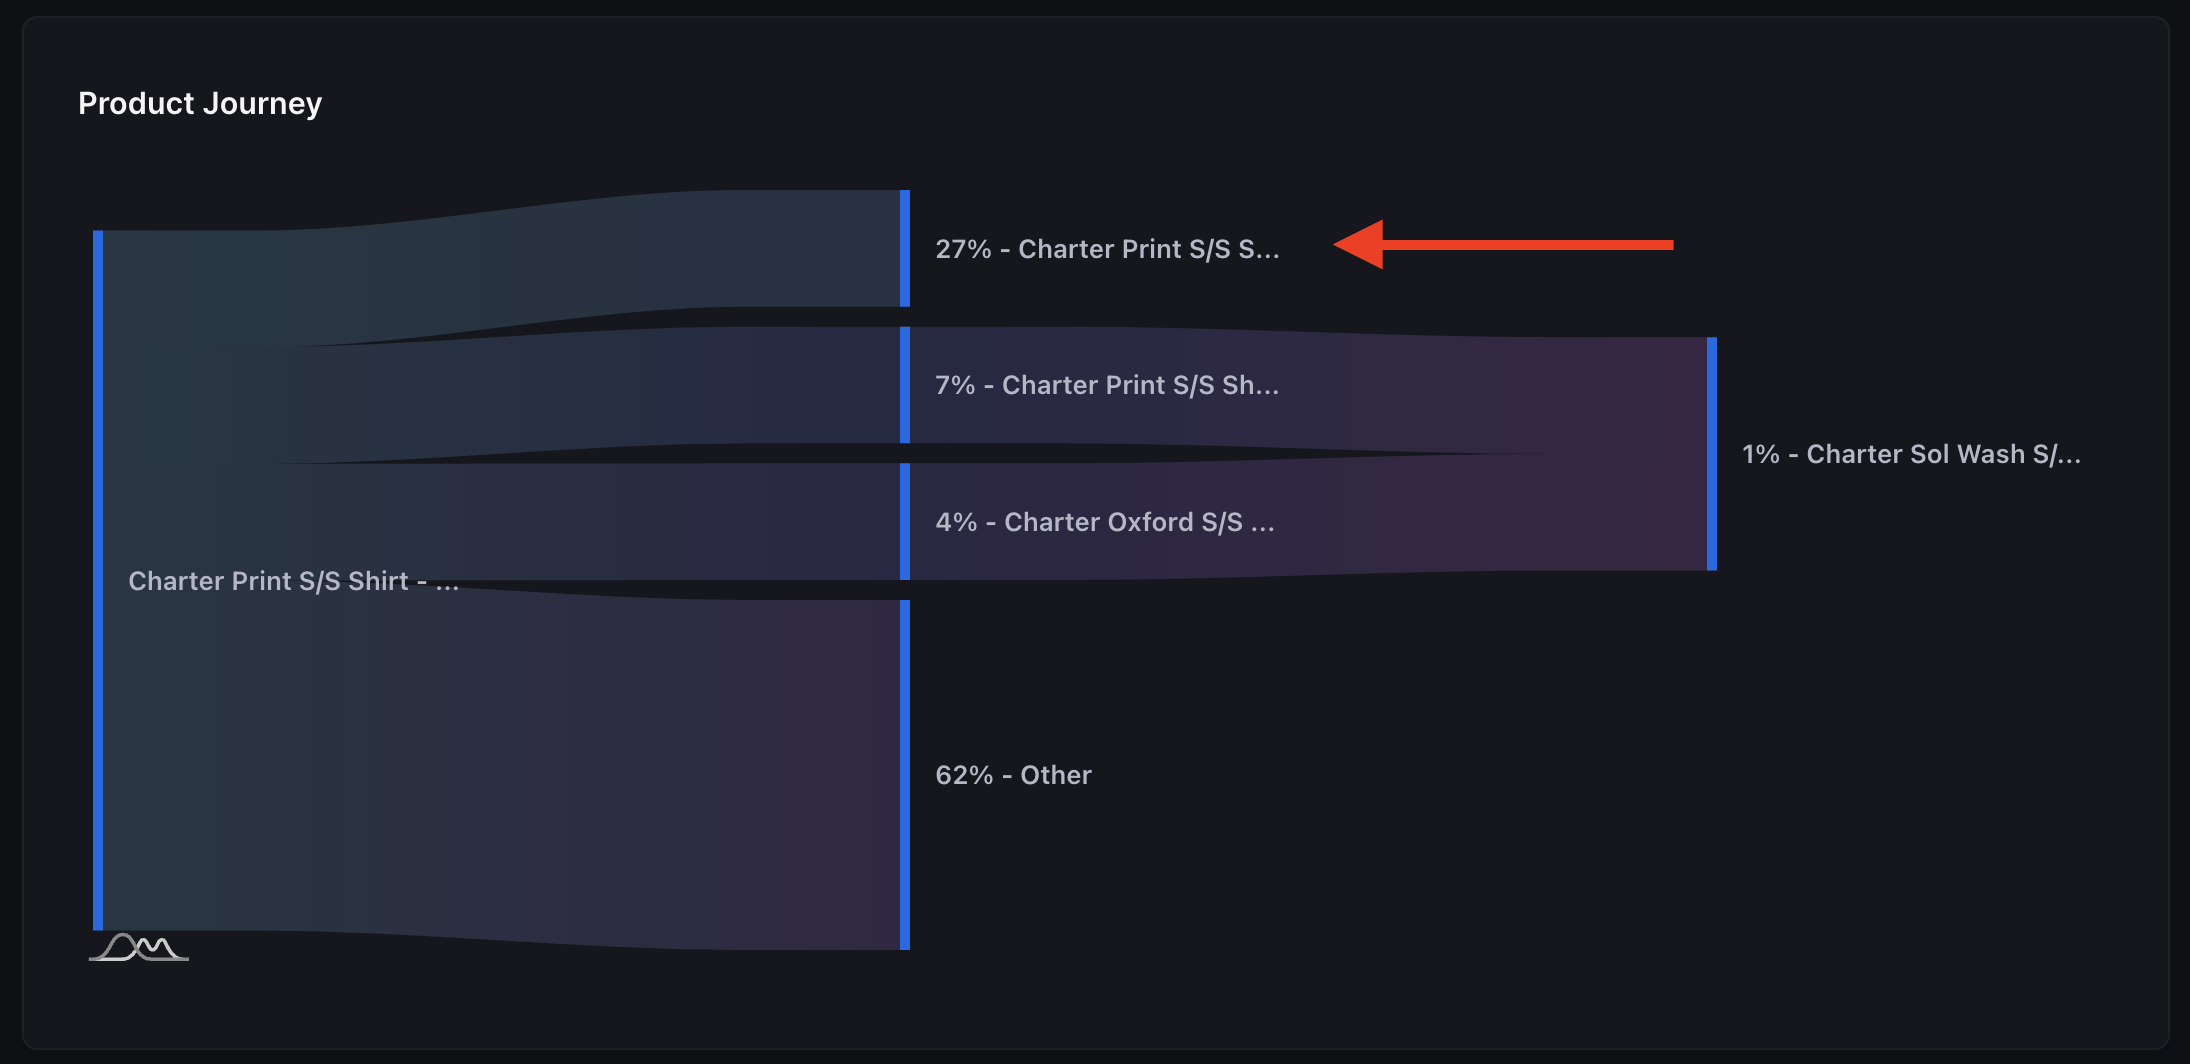
In the below example, 27% of customers did not buy again after their first purchase of the Charter Print S/S Shirt. However, 7% bought that same shirt in a different colorway, and 4% bought the Charter Oxford S/S shirt next.
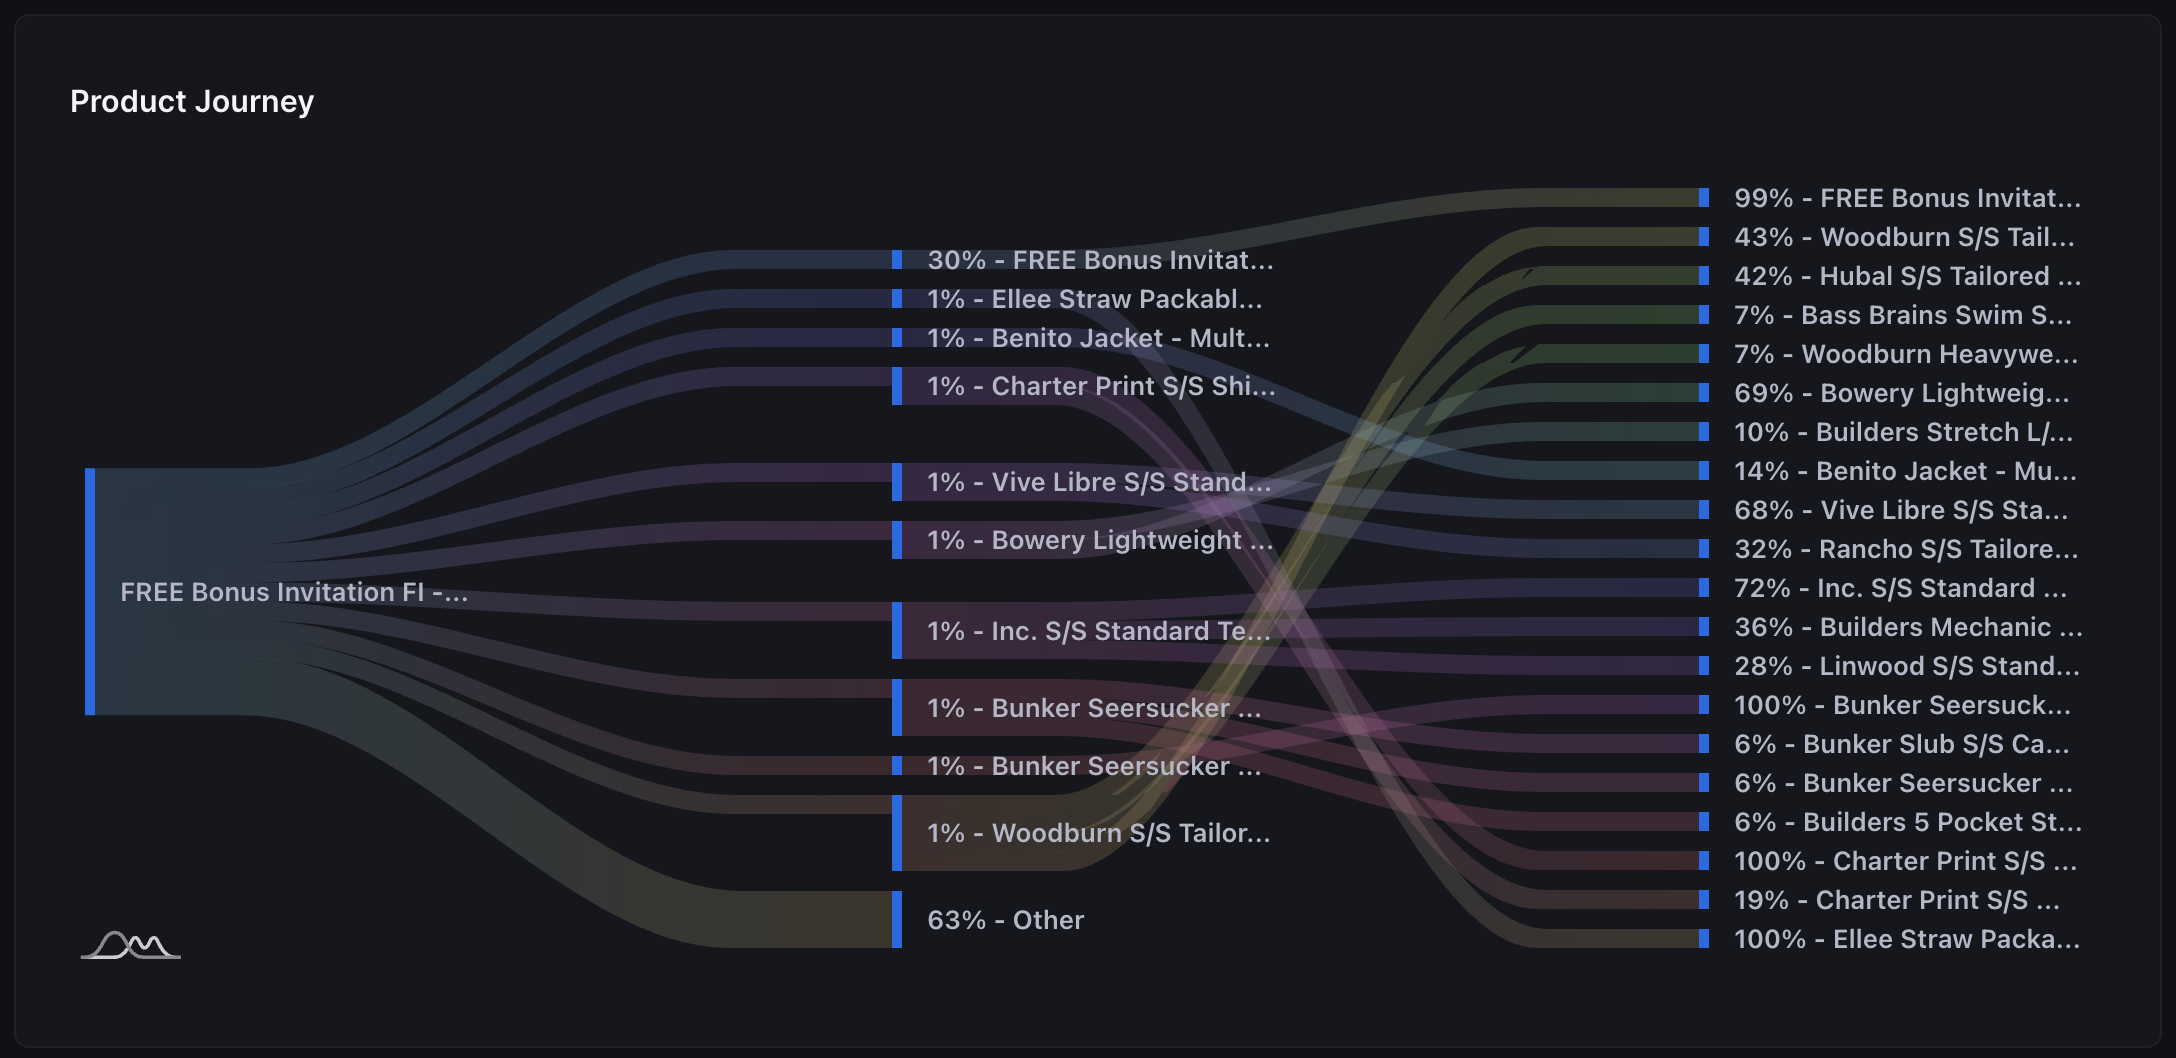
How to create and analyze upsell flows
On the far left side, AdBeacon presents the top 10 products sold within the selected time frame.
- First, select how many products you’d like to show, the options are 3,5 and 10. Depending on what you decide, your upsell flows can be as intricate as you’d like with varying products.
- ex) Product journey report with top 3 products bought next
- ex) Product journey report with top 5 products bought next
- ex) Product journey report with top 10 products bought next
- ex) Product journey report with top 5 products bought next
- ex) Product journey report with top 3 products bought next
- Identify which products you want to feature next in your advertising and which channels are best to reengage with your existing customers.
- Discover which channels get returning customers to buy at the lowest cost per acquisition (check out the new vs returning report).
Consider creating an email flow featuring the products that customers tend to buy within that product cohort and buying behavior. For example, if we know that customers who buy a brown full brim hat are most likely to buy that same hat in another color, create a flow featuring the top 3 colors sold.