
Creative Dashboard
| Owner | |
|---|---|
| Tags | Data & AnalyticsProcess |
Introducing: the AdBeacon Creative Dashboard
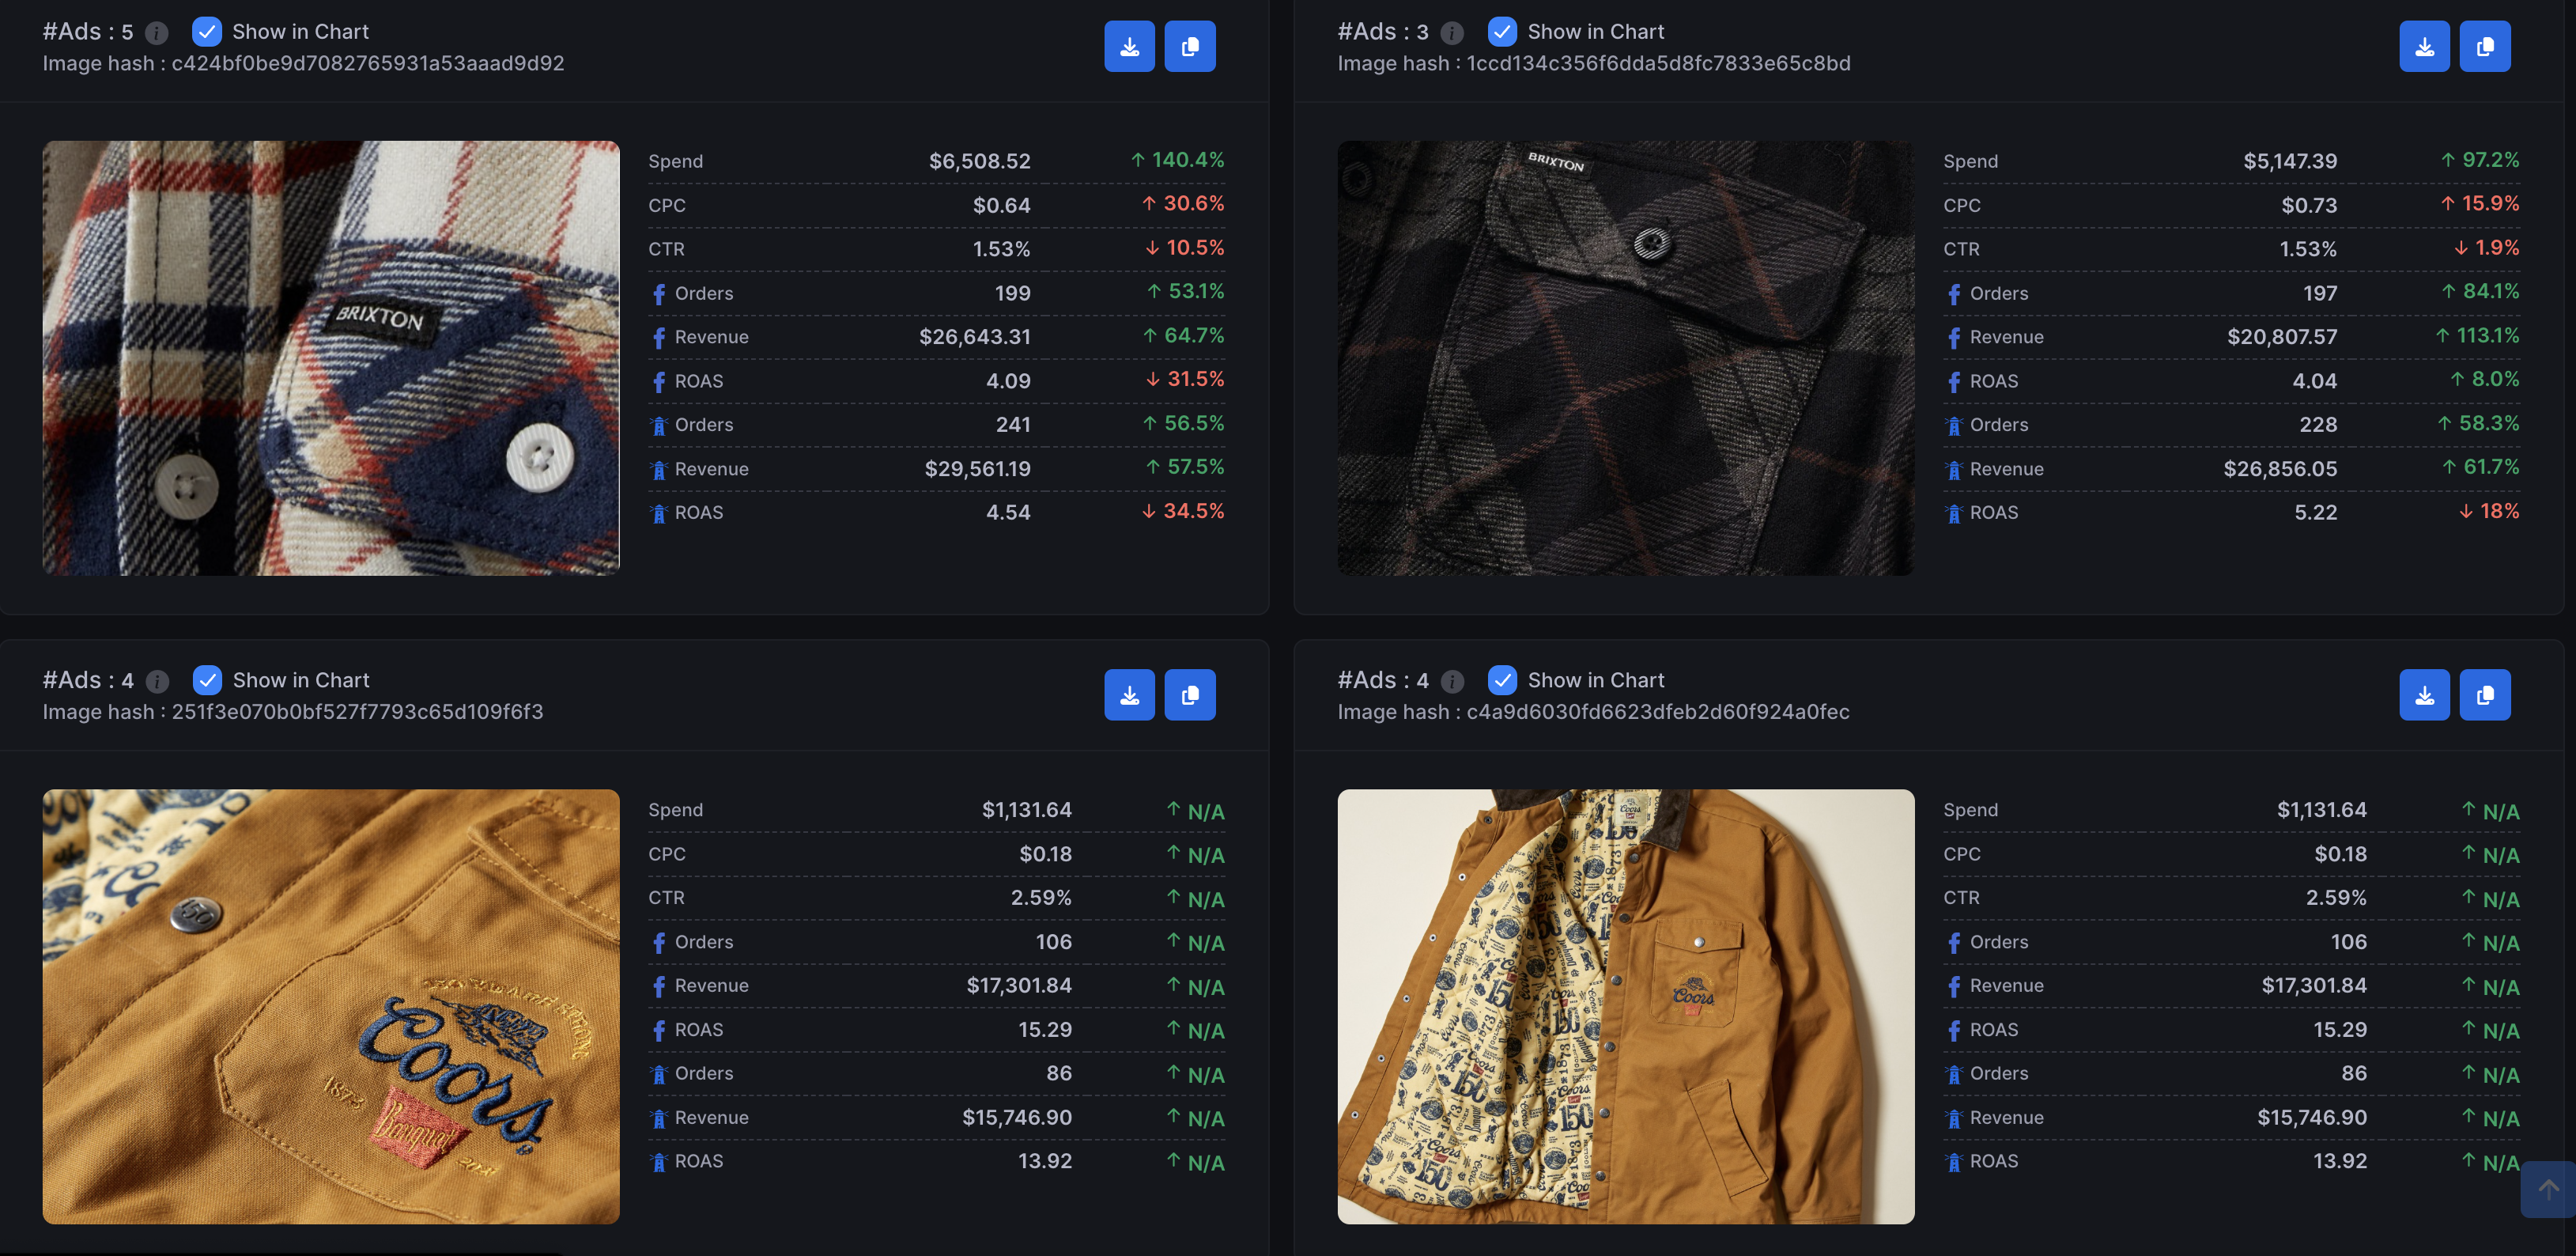
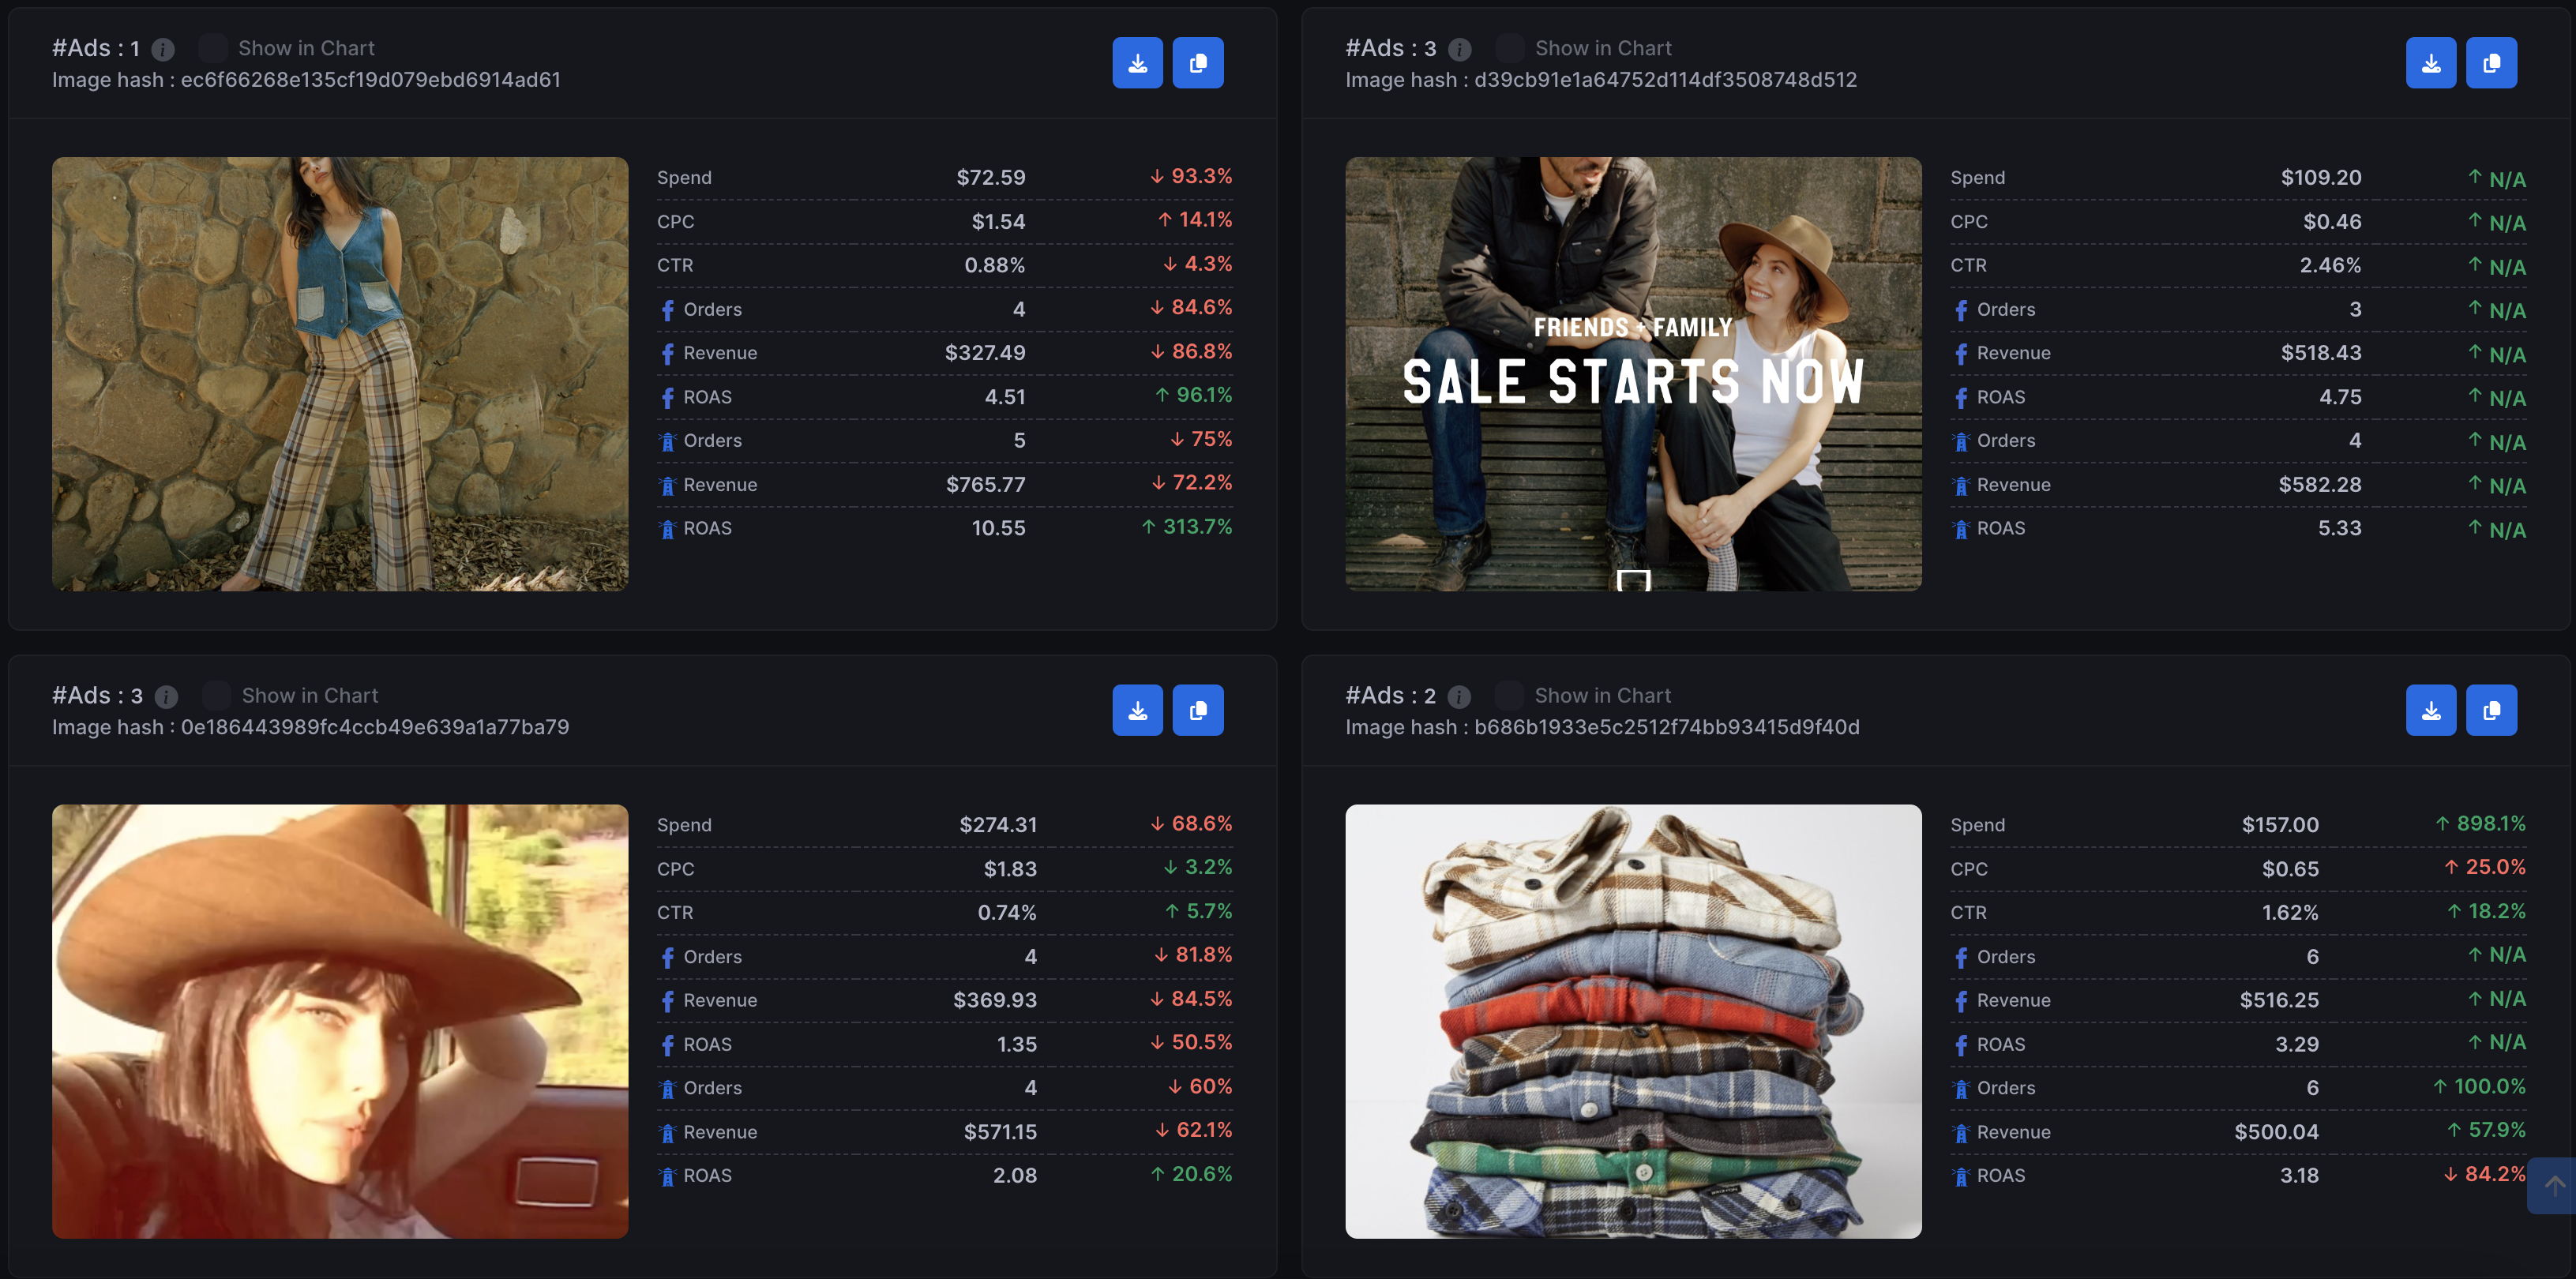
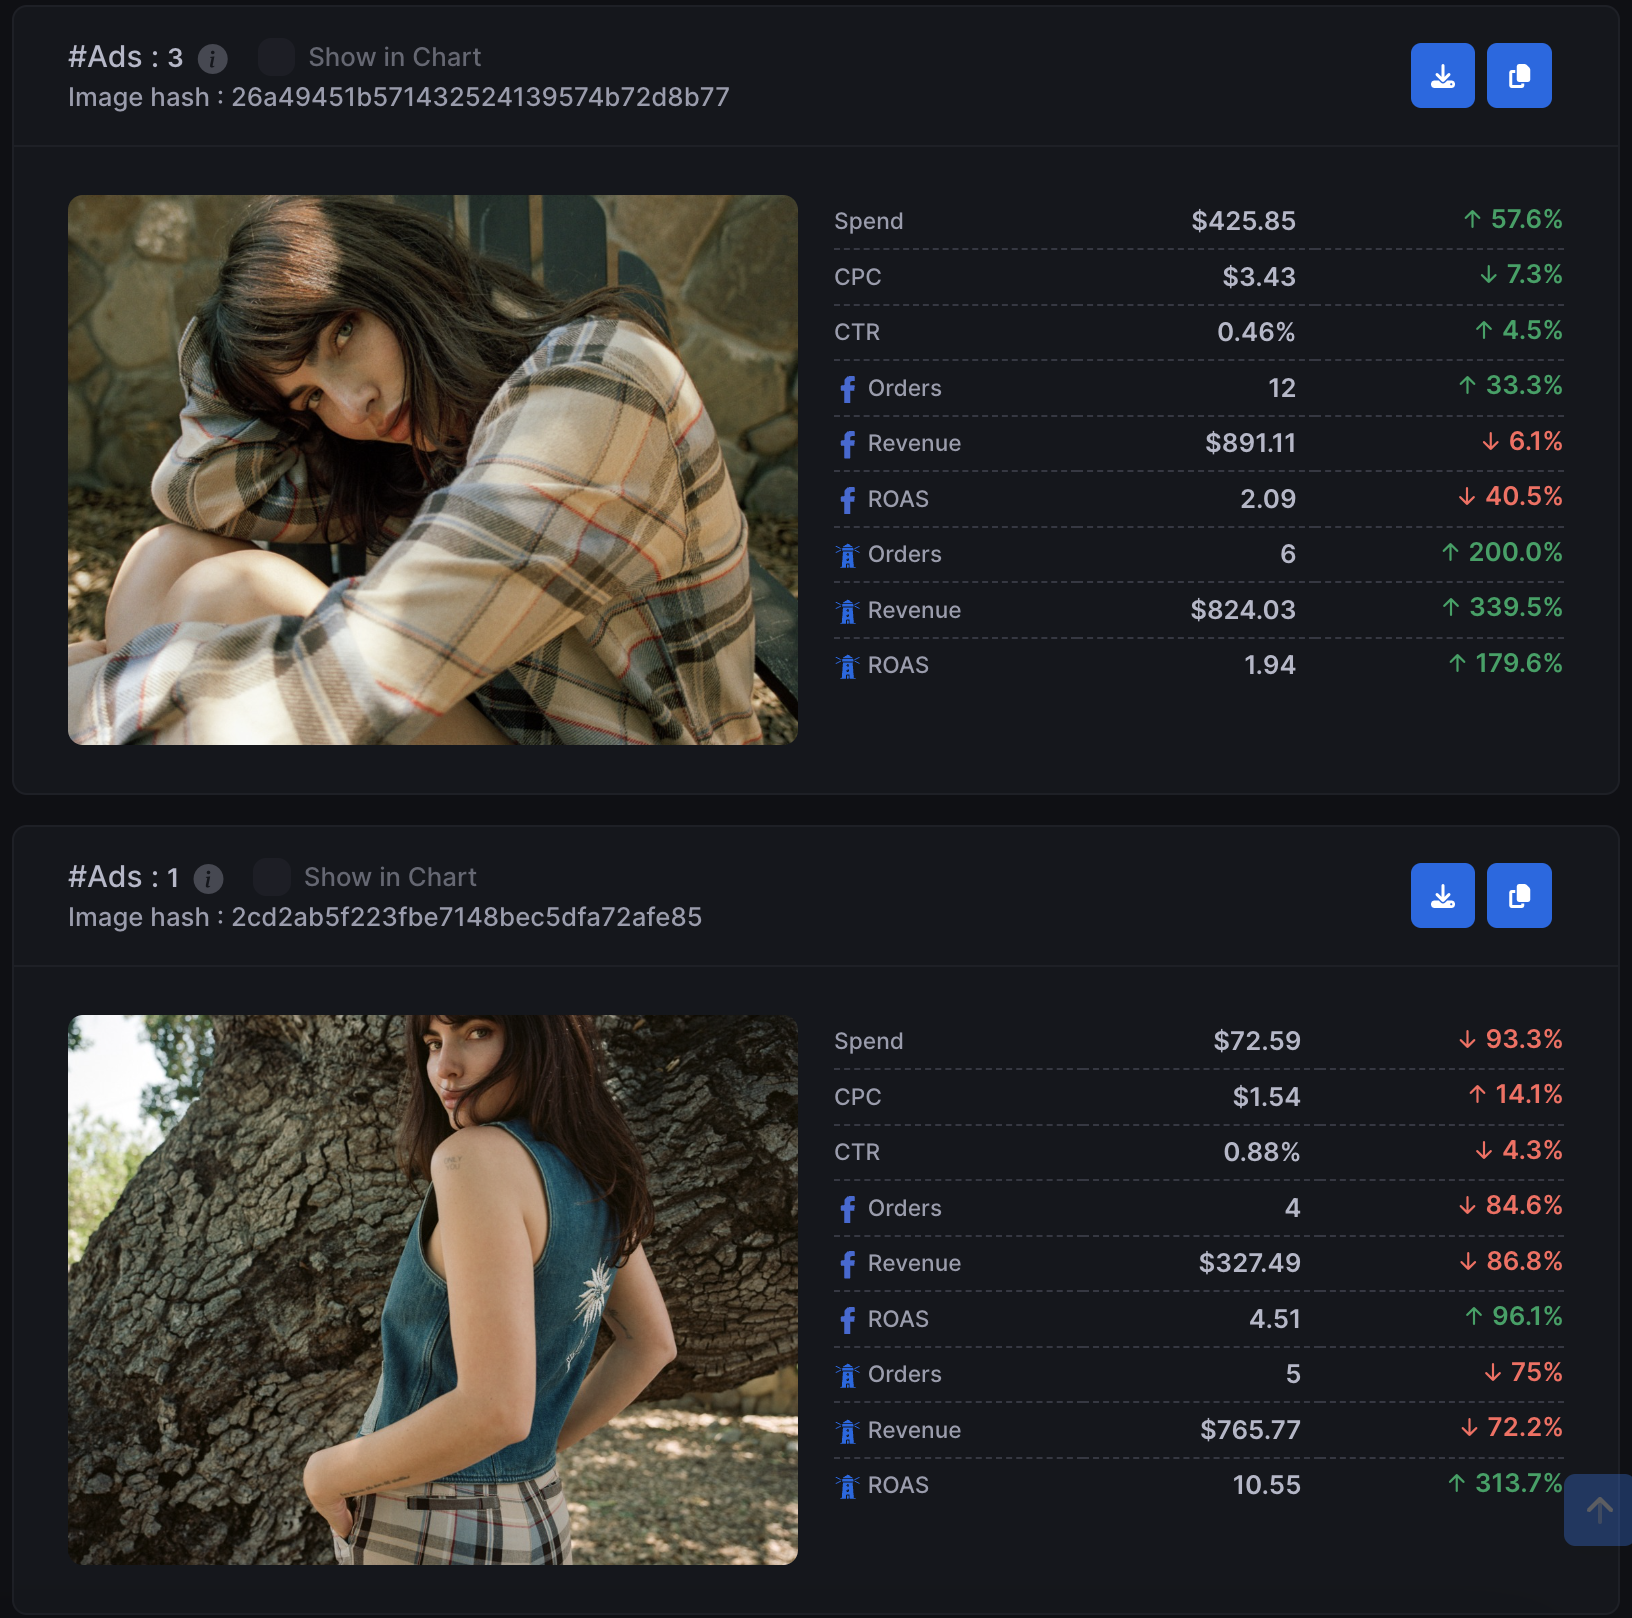
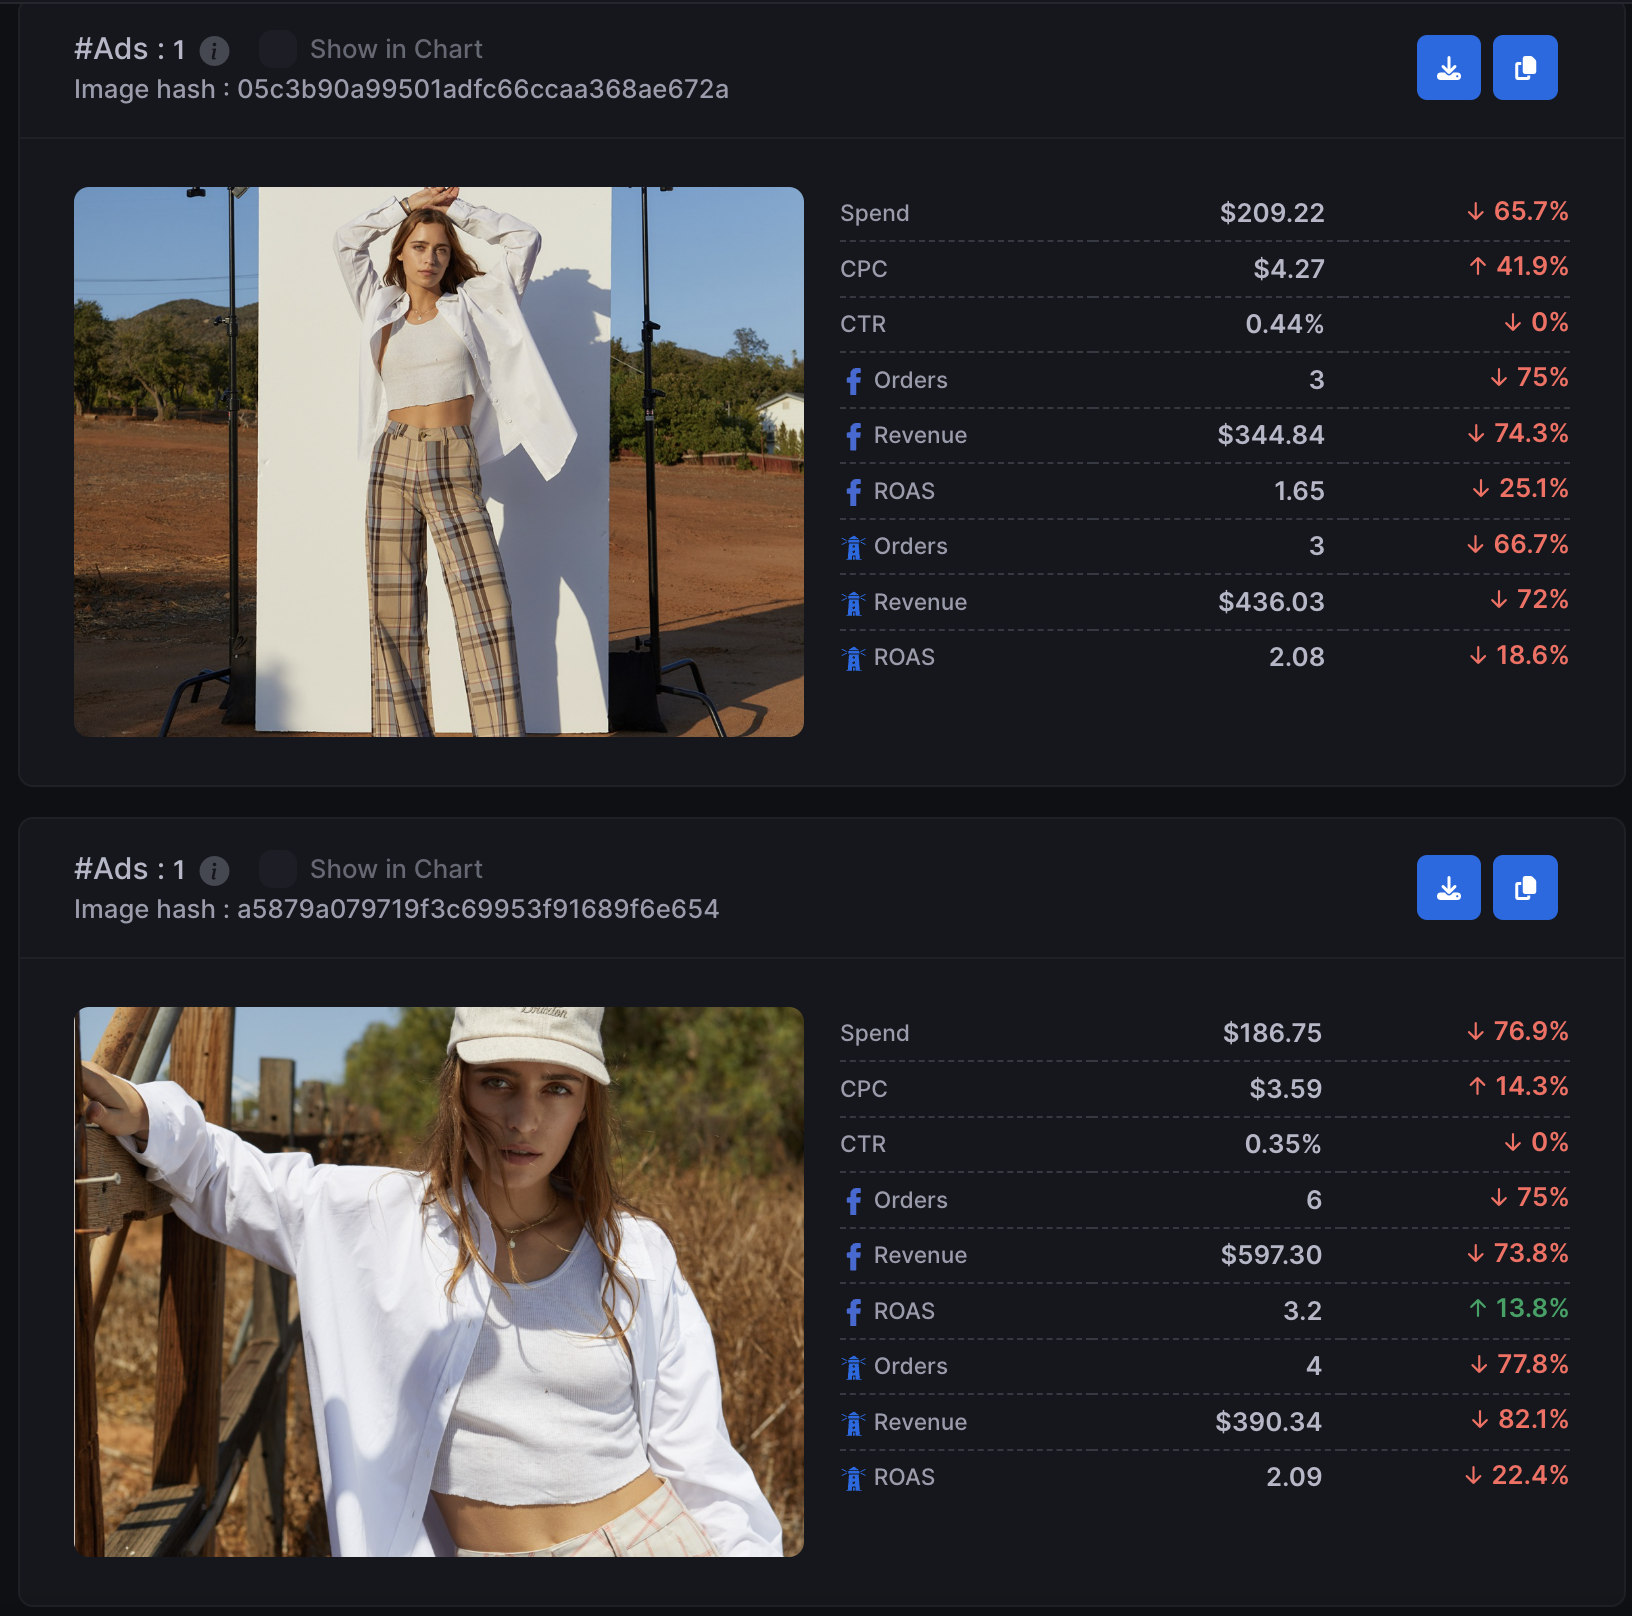
AdBeacon pulls the image hash to find any/all variations of that specific image or video. Then, takes an aggregate of the data to give your team a true analysis of how that creative is doing across the entire account and the duplicates made.
In other words, if you use the same image in 15 ads, but change the copy, AdBeacon is able to show can report based on the image alone or the image and copy variations.
With this methodology, AdBeacon is able to showcase what the winning formula is. Was it the image that performed well, or was it the image and copy together, or was it just the copy.
As your team makes decisions related to creative, it’s important to have data you can trust - which is why there is purchase proof behind every metric AdBeacon reports, even in the creative dashboard.
Which platforms are included in the Creative Dashboard?
What creatives are my winners vs losers?
In AdBeacon, you’re able to filter by specific metrics to decide on which creative/creative variations are clear winners to double down on.
Consider asking these questions when analyzing your creatives in AdBeacon:
- Is there a specific style of photography/template/layout that is outperforming others?
- Does one model drive far more revenue than another model?
- Does in studio creative do better than lifestyle imagery?
- What creative drives the most revenue with new customers?
Example with analysis
To find what creative drives the most revenue with new customers, filter the top by AdBeacon revenue, and select New Customers in the drop down menu

Here, you’ll be able to identify which image, video, copy, image and copy variations, and video and copy variations drive them most revenue for new customers.
If your goal is to scale new customers, consider pushing these creative types to achieve your desired result.

- What creative drives the most revenue with returning customers?
Example with analysis
To find what creative drives the most revenue with returning customers, filter the top by AdBeacon revenue, and select Returning Customers in the drop down menu

Here, you’ll be able to identify which image, video, copy, image and copy variations, and video and copy variations drive them most revenue for returning customers.
If your goal is to scale returning customers, consider pushing these creative types to achieve your desired result.

Does AdBeacon just pull in data from META/Tiktok/Pinterest/Snapchat for the Creative Dashboard?
AdBeacon tracks separately from META, Tiktok, Pinterest, and Snapchat across the entire platform, including the creative dashboard. While AdBeacon does pull metrics reported in your advertising platforms, it is presented for the purpose of comparison.
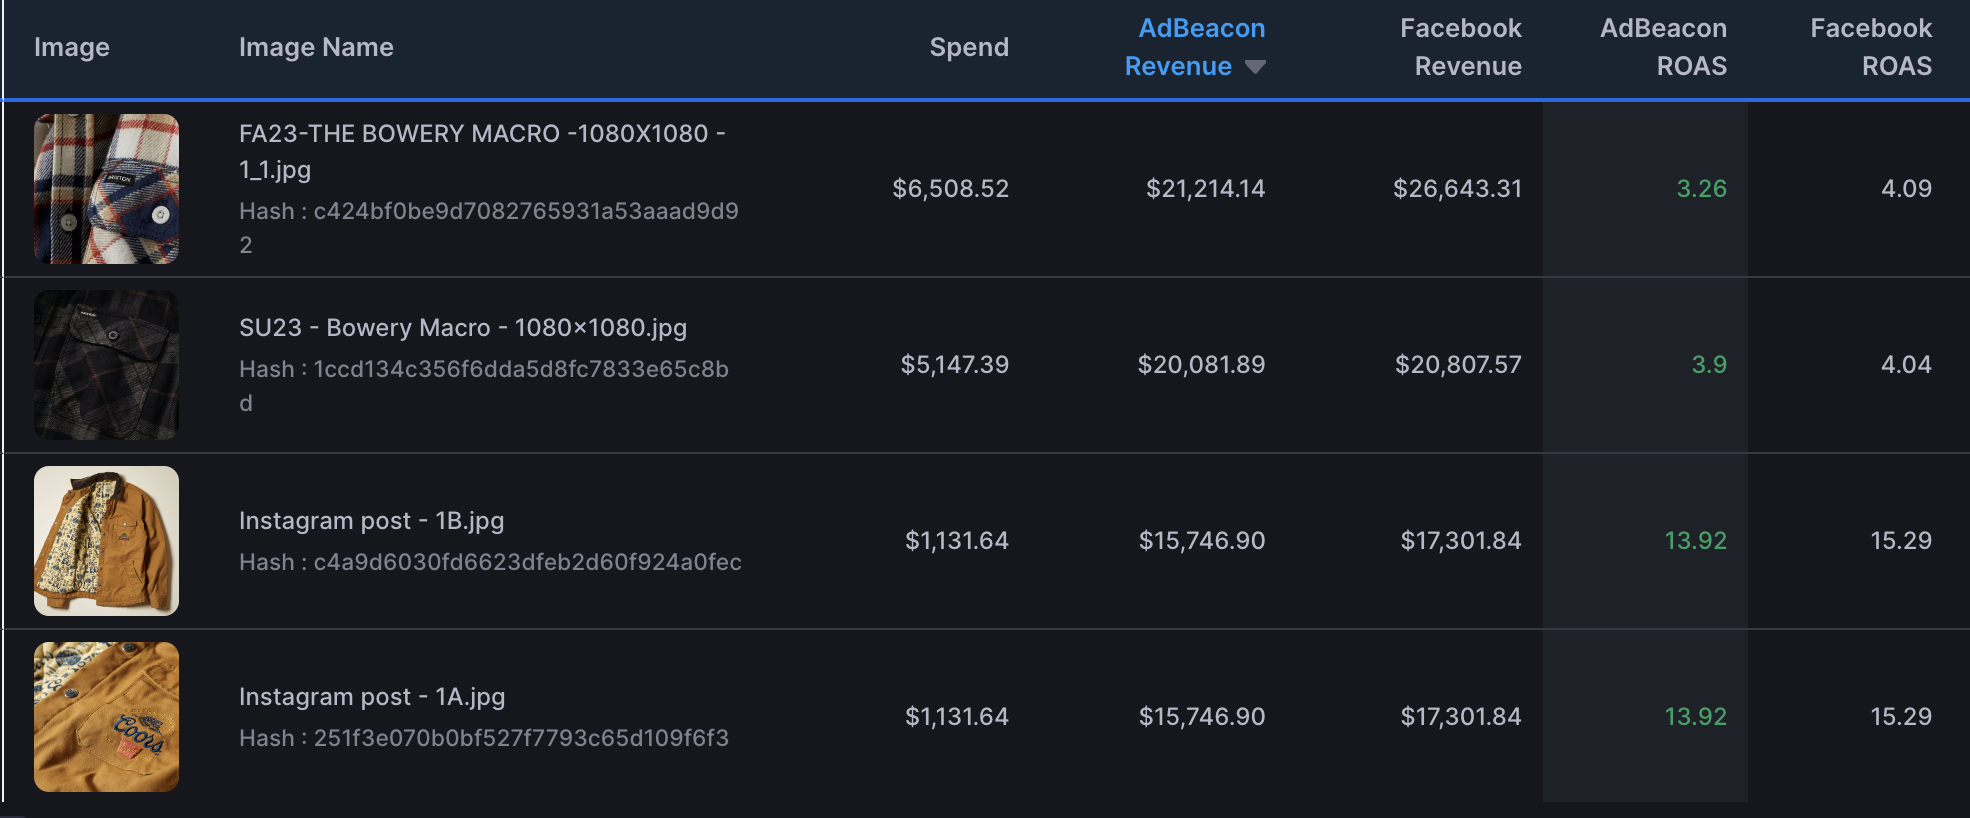
All conversion specific metrics presented in AdBeacon have proof behind the purchase with a full customer journey to the sale, so your teams feels confident in data driven decision making.
Click on the creative being reported on the AdBeacon Creative Dashboard to uncover every purchase made, the click journey, and the exact campaign/adset/ad that led to the sale.
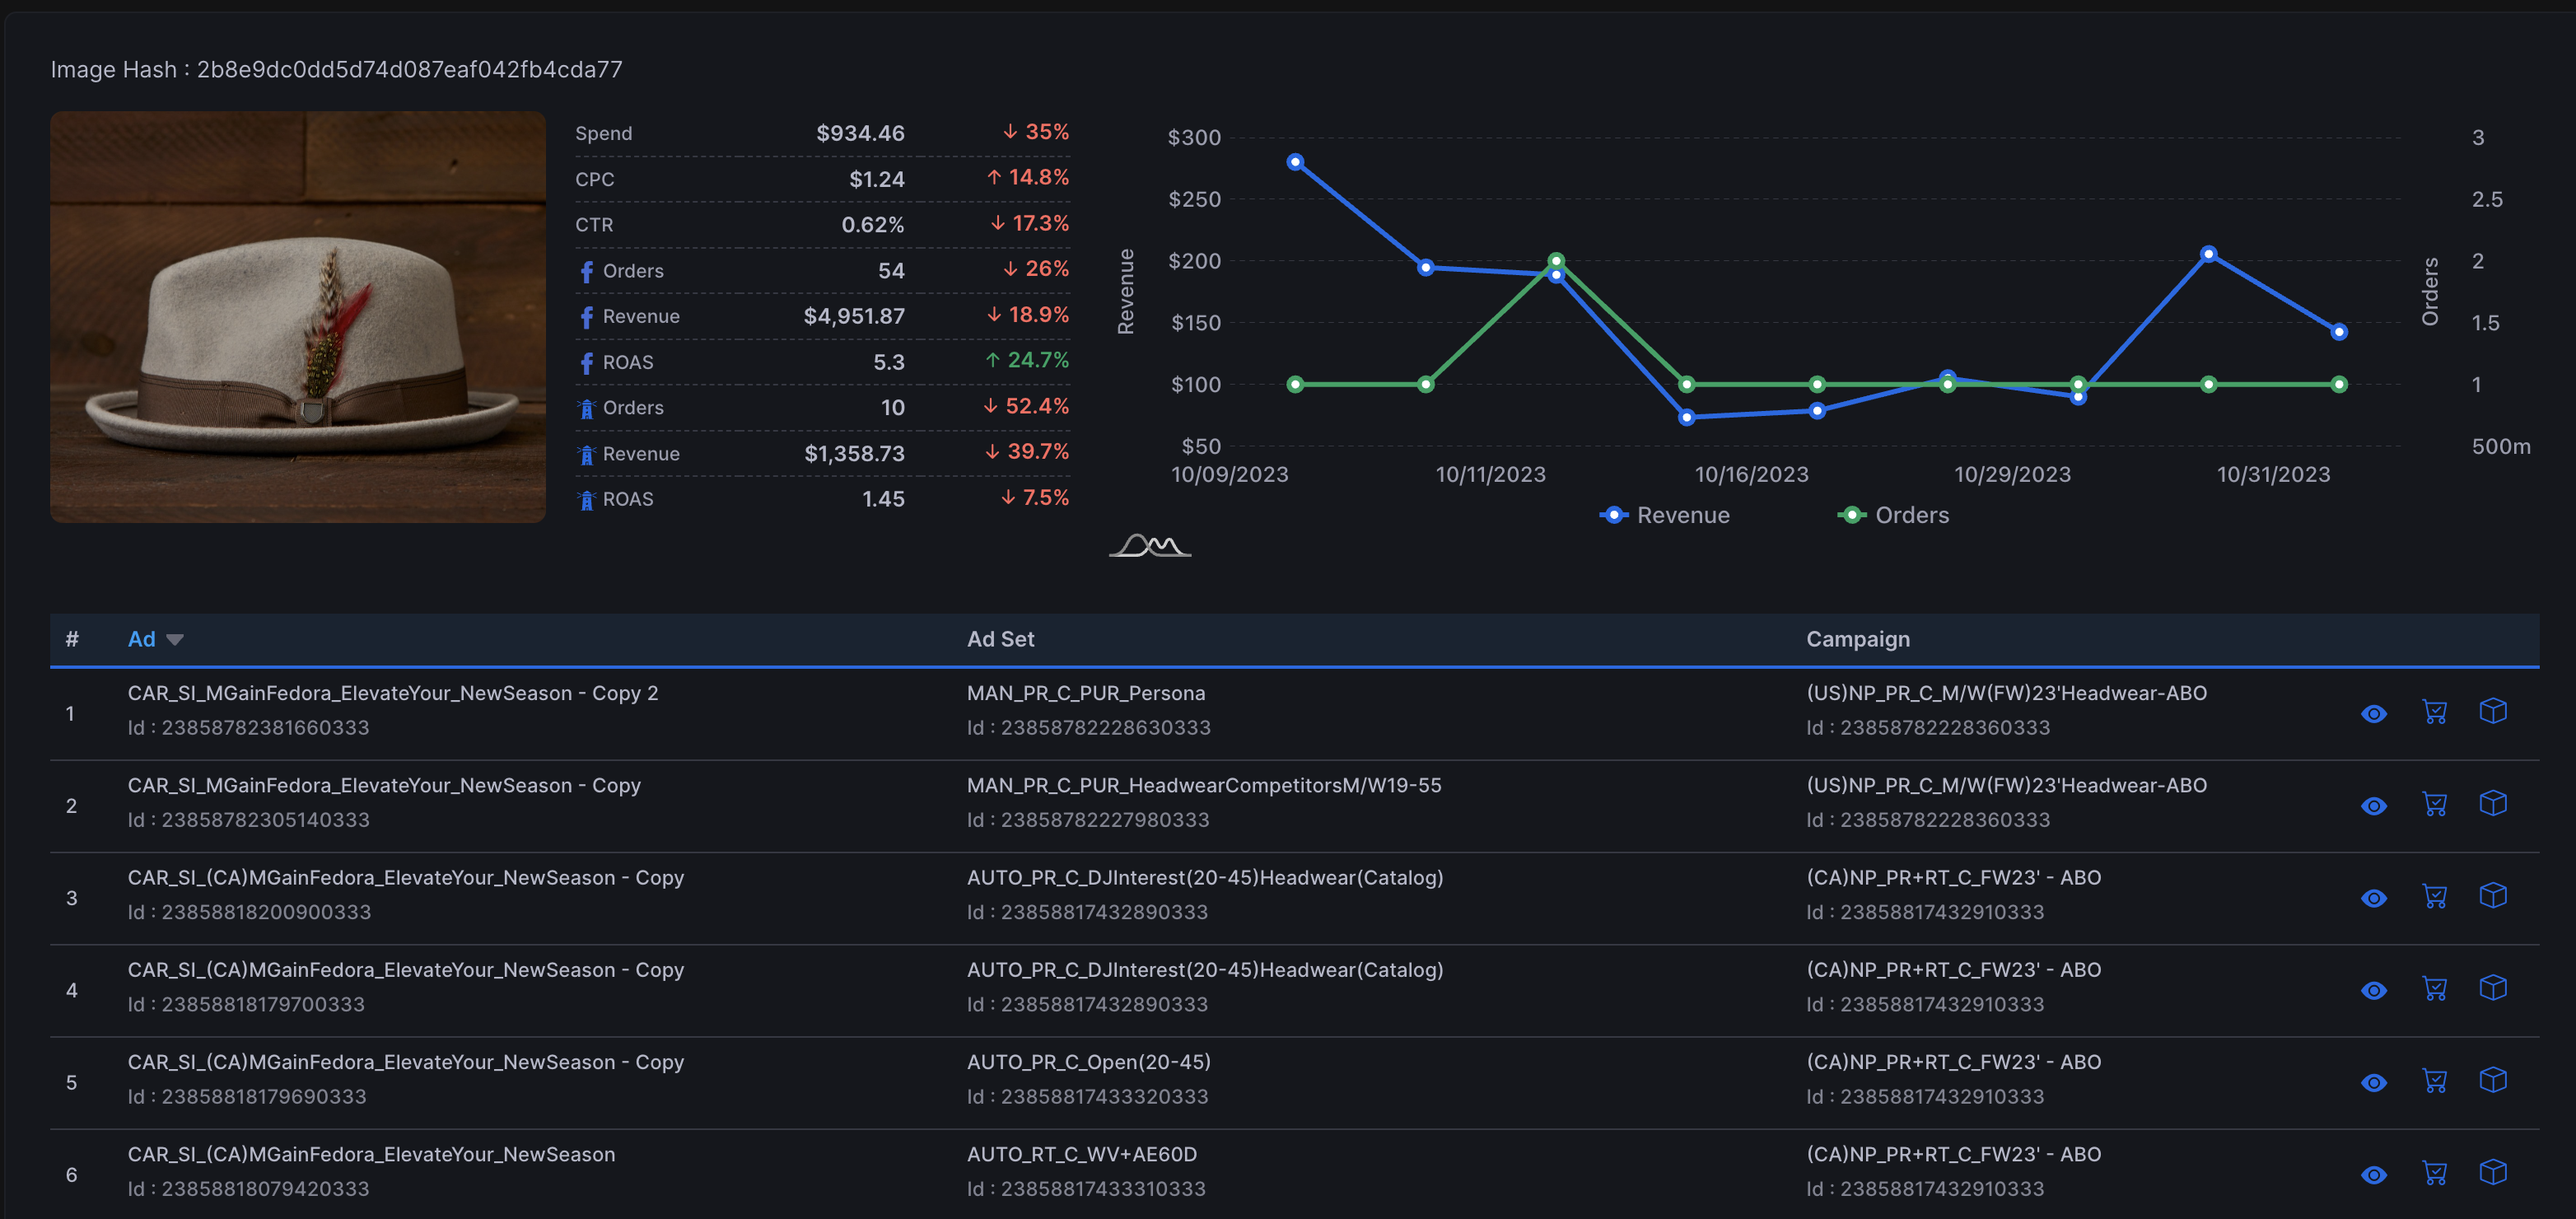
What can I filter in the AdBeacon Creative Dashboard?
The filters you can sort by in the Creative Dashboard are:
- Image
- Video
- Copy
- Image and copy
- Video and copy
Attribution model & time
- First click
- Last click
- Linear
- Full impact
Customer segment
- All customers
- New customers
- Returning customers
- Any/all audience segments created in Audience builder
Metrics
- Spend
- CPC
- CTR
- Thumbstop ratio
- AdBeacon revenue
- AdBeacon ROAS
- AdBeacon orders

.png)